


Hi everyone! 👋
Welcome to Lesson 5 of our six-week course on building a production OCR system.
Quick recap of where we are. In Lesson 1 we laid the Kubernetes foundations. In Lesson 2 we walked ten years of OCR architecture. In Lesson 3 we deployed a vLLM server on a GPU node and pointed a small FastAPI service at it. And last week in Lesson 4 we threw that FastAPI service away and rebuilt the front door in Rust, because it turned out to be the first thing that breaks under real traffic.
So the ingress is fast now … I mean, genuinely fast! Axum and Tokio will chew through concurrent multi-megabyte uploads without breaking a sweat. That design is excellent, as long as every request finishes in a second or two.
But here's what happens the moment real customers show up. Someone uploads a 120-page annual audit report and asks for visual grounding on every table in it. Someone else drops in a 45-minute audio recording for a Whisper transcription pipeline.
These are not 200-millisecond queries, but compute-bound batch jobs that take anywhere from fifteen seconds to several minutes. And that breaks something fundamental about HTTP:
👉 In a synchronous world, a slow request and a dead server look exactly the same.
Nobody in the request path can tell the difference: not your load balancer, not the customer's corporate firewall, not the client library. So they all guess, and they all guess wrong.
Today we fix that. We're moving from request-response to queue-driven architecture: a producer that accepts work and walks away, a pool of workers that pulls work when it's ready, and a queue in the middle that lets those two sides scale completely independently.
Along the way we'll use that queue to do something you simply cannot do in a synchronous API: dynamic batching, which is how you actually get your money's worth out of an A100. And we'll put a proper governance layer at the cluster edge, so a single misbehaving script can’t autoscale your GPU bill into orbit.
Let's get started! 👇
💻 The production OCR code is open-source. Support our work by dropping a friendly ⭐ on the repo!
Why HTTP Breaks
Let's start with the mental model, because everything else follows from it.
Think of a synchronous HTTP request as a phone call. The client dials, and the line stays open (holding a socket and a file descriptor on both ends, plus a slice of kernel memory for the buffers) until the server has finished saying everything it has to say. Neither side can hang up early without the other treating it as a failure.
For a normal CRUD app, that call lasts 25 milliseconds. Holding the line open costs you nothing. Now look at what our OCR endpoint actually does. A single-page receipt comes back in 400 milliseconds. A dense 80-page vector PDF full of financial tables takes 90 seconds to get through layout discovery and token generation.
Same endpoint, and same code path … but more than two hundred times the duration.
That variance is what kills synchronous architectures, and it kills them in three distinct ways.
❌ Failure 1: You run out of connections before you run out of GPU
Every open request occupies a file descriptor, a slot in your worker pool, and space in the OS socket table. When a few hundred clients are all holding the line waiting for inference, your gateway hits its descriptor limit and stops accepting new handshakes entirely.
The cruel part? Your GPUs might be half idle. The bottleneck isn't compute, it's bookkeeping. You've run out of places to remember who's waiting.
❌ Failure 2: Something in the middle hangs up for you
Your request doesn't travel from the client straight to your pod. It passes through Azure Application Gateway, maybe Cloudflare, maybe an NGINX ingress, and very often a corporate VPN. Every one of those hops enforces an idle read timeout, typically 30 to 60 seconds.
"Idle" is the important word. If your model spends 45 seconds compiling CUDA kernels and running prefill before it emits a single response header, that connection looks dead to every proxy in the chain. One of them cuts it.
Now trace what happens next:
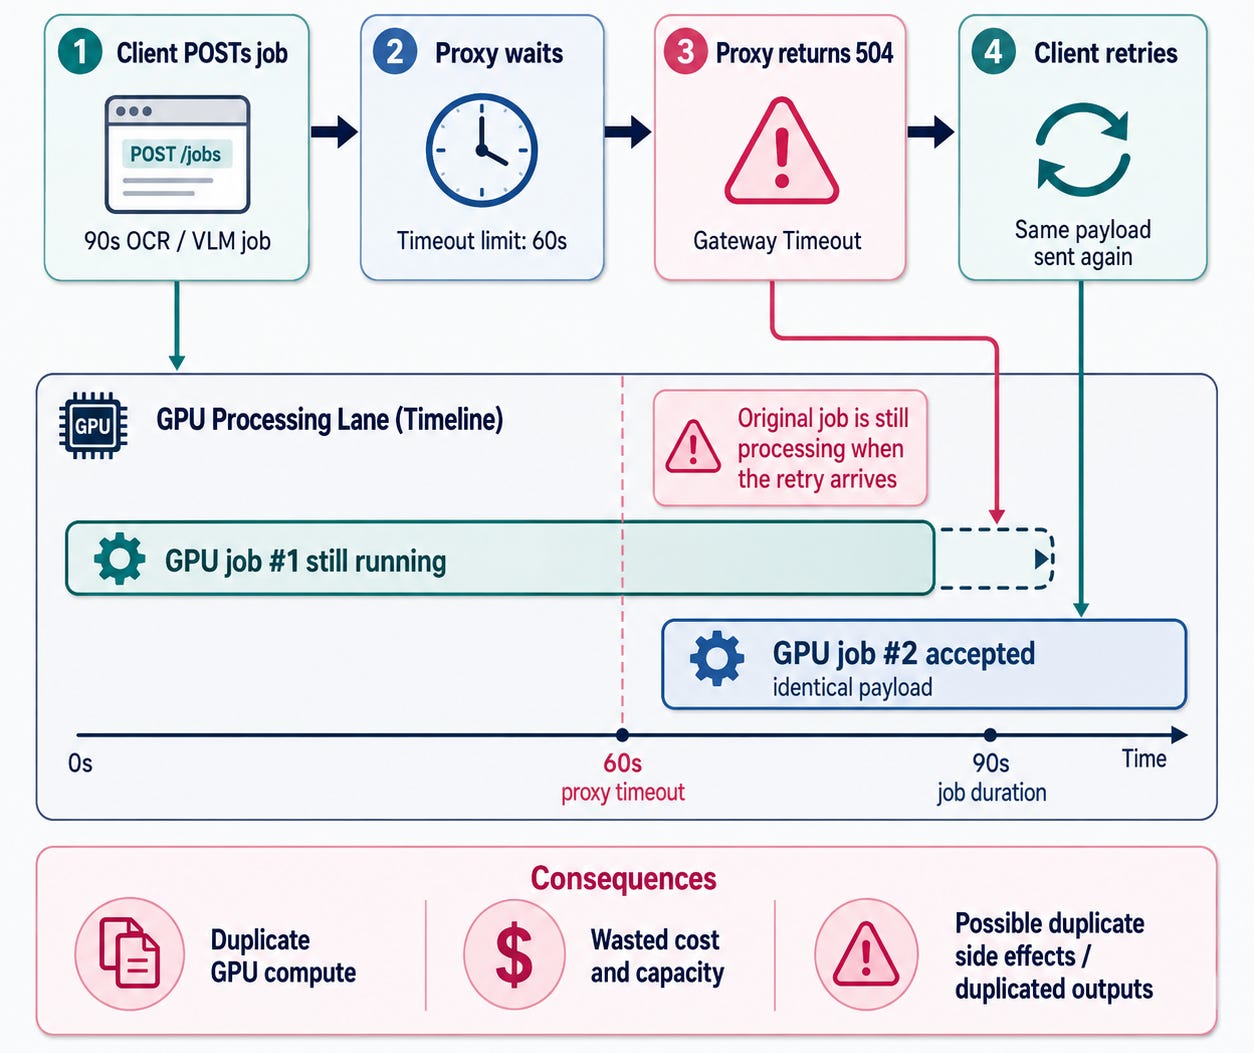
The customer sees a 504 Gateway Timeout and retries immediately, because that's what every sane HTTP client does. Your GPU is now burning cycles on a job whose recipient has already given up, and it just accepted a duplicate of the same work. Multiply that across a few hundred users and your expensive hardware fills up with zombie jobs while everybody stares at error pages.
❌ Failure 3: One big document ruins everyone's day
This one is called head-of-line blocking, and it's the least obvious of the three.
Your synchronous worker pool has, say, 8 slots. A customer uploads 8 large documents. Every slot is now busy for the next 90 seconds.
The next request in line is a single-page receipt that would have taken 400 ms. It waits a minute and a half in the server backlog, and there is nothing wrong with it at all. The slowest request in the system sets the latency for every request behind it.
Why OCR and Speech are the worst offenders
This isn't specific to documents. It's the shape of every heavy AI modality. Both of our workloads are multi-stage pipelines, not single model calls:
Visual Document Understanding. In systems like GLM-OCR or PaddleOCR-VL, one "request" means: run a layout segmentation model (PP-DocLayoutV3) to find the tables, text blocks, stamps and formulas → crop each of those regions → send batches of visual tokens to a Vision-Language Model. Total time scales with page count, visual density, and table complexity.
Speech-to-Text. A 60-minute interview means: chunk the audio → run Voice Activity Detection → convert to mel-spectrograms → decode autoregressively, one token at a time. FlashAttention and batched inference help enormously, but an hour of audio is still an hour of audio.
Neither of these should ever be sitting inside an open HTTP connection. The whole solution is one idea. Stop trying to return the result, but return a claim ticket instead.
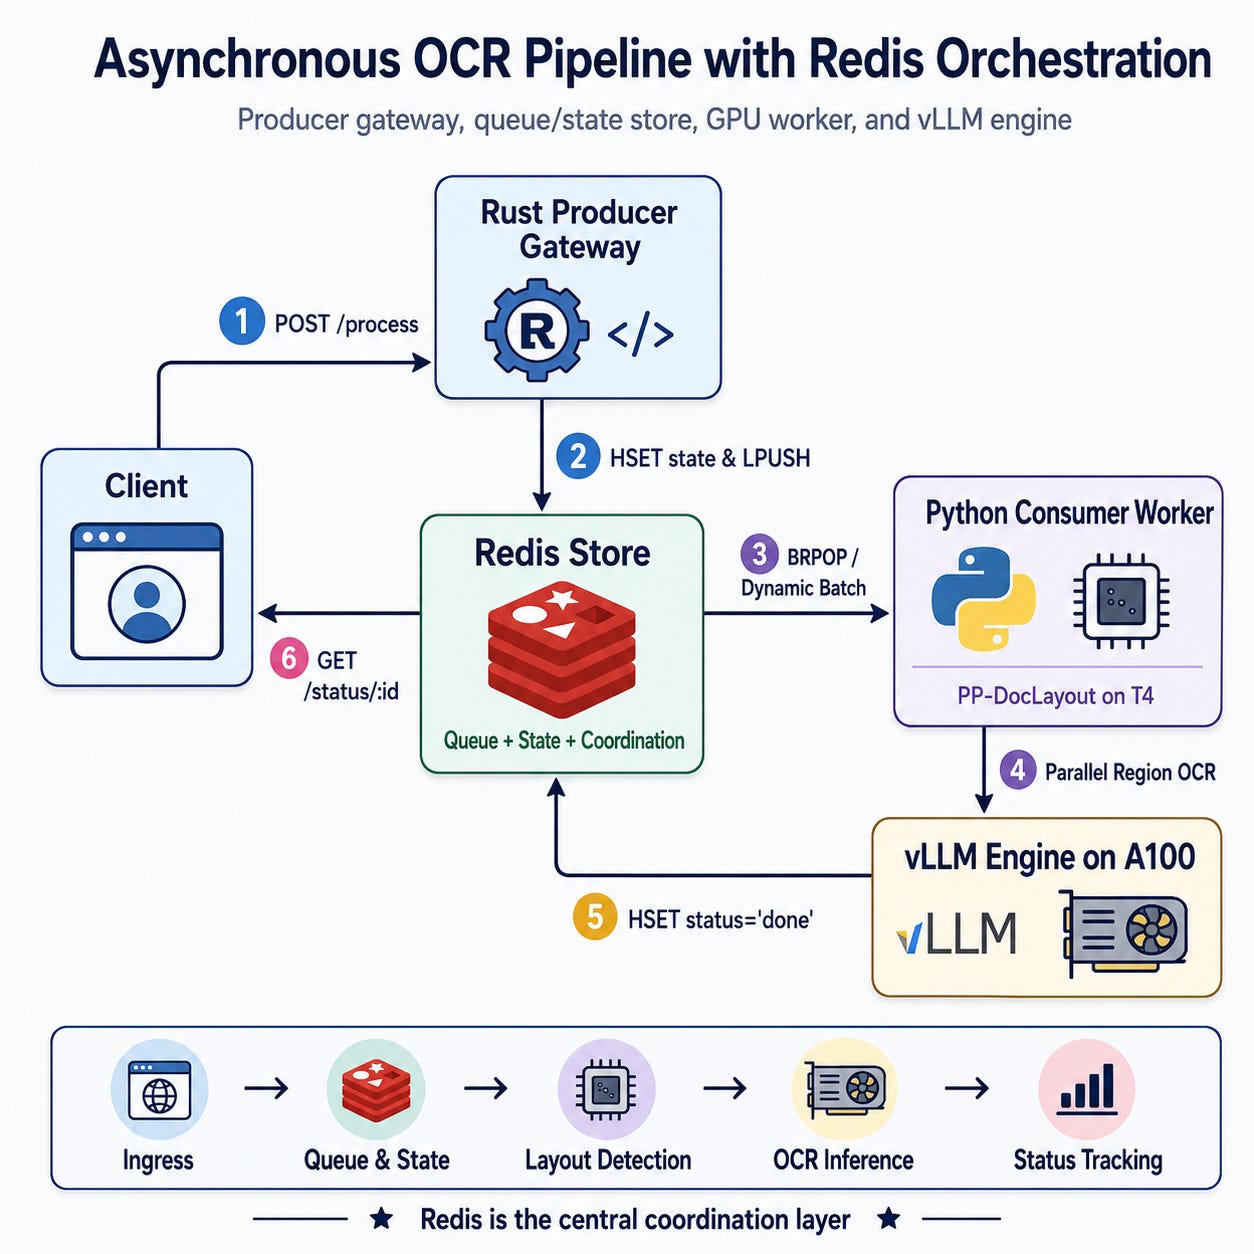
The client uploads its payload, gets back an immediate 202 Accepted with a task_id, and hangs up. No connection is held open, and no proxy has anything to time out.
From there the client polls /status/:task_id, subscribes to a notification channel, or waits for a webhook. Whichever it picks, the GPU work is now completely decoupled from anybody's network connection.
Dynamic Batching
Connection stability is the reason people build queues. But it's not the biggest payoff.
The biggest payoff is that a queue lets you choose when to start work, and that turns out to be worth a fortune in GPU efficiency.
👉 A GPU is a bus, not a taxi. It costs almost the same to run whether one passenger is aboard or forty.
Modern tensor cores hit their advertised FLOPS only when they're fed wide, parallel matrix multiplications. Send requests through one at a time and the GPU spends most of its wall-clock time not computing: launching CUDA kernels, pulling model weights out of HBM for a batch size of one, then sitting bandwidth-starved through the decode phase.
👉 You pay full price for the bus and carry one passenger.
In a synchronous API you're stuck with that, because the only way to batch is to make the first caller wait for strangers to arrive, and you have no idea when or if they will.
A queue removes that problem entirely. The worker can look at the queue, see exactly how much work is waiting, and decide. Here's the pattern, usually called the collector or batching window:
MAX_BATCH_SIZE = 8
BATCH_WINDOW_MS = 100

async def collect_batch():
    # Block until there is at least ONE task. No polling, no wasted CPU.
    first = r.brpop("ocr_tasks", timeout=5)
    if not first:
        return []

    batch = [first[1]]

    # We have work. Hold the door open briefly and see who else shows up.
    deadline = time.monotonic() + (BATCH_WINDOW_MS / 1000.0)

    while len(batch) < MAX_BATCH_SIZE and time.monotonic() < deadline:
        nxt = r.rpop("ocr_tasks")   # RPOP pairs with the producer's LPUSH → FIFO
        if nxt:
            batch.append(nxt)
        else:
            await asyncio.sleep(0.005)

    return batch                     # departs early the moment it's full
Three properties that matter:
Quiet traffic stays fast. With one task in the queue,
brpopreturns instantly and the worker waits at most 100 ms before departing. That's the entire latency penalty you pay for batching: a rounding error next to a 90-second job.Busy traffic batches itself. When 50 documents land at once, the window never expires.
rpopreturns a task every time, the batch fills to 8 immediately, and the worker leaves at full capacity. The system gets more efficient precisely when it's under the most load, with no tuning and no separate code path.You stop paying the kernel-launch tax eight times over. Instead of eight separate layout-detection passes, the worker runs image normalisation and layout discovery for all eight pages as one parallel tensor operation. In our lab this cut per-page GPU time by well over half, though the exact win depends on how small your batch-1 kernels were to begin with, so measure it on your own workload.
⚠️ Watch the pop direction. Our producer uses
LPUSH, so the worker must useRPOP/BRPOPto drain the other end of the list. PairLPUSHwithLPOPby mistake and you’ve built a stack, not a queue: newest tasks jump the line and your oldest documents can starve indefinitely under sustained load. It’s a one-character bug that only shows up in production.
Cluster Topology
Now let's place all of this on real hardware. The lab runs on Azure Kubernetes Service, split into four tiers, each mapped to the cheapest SKU that can actually do its job:
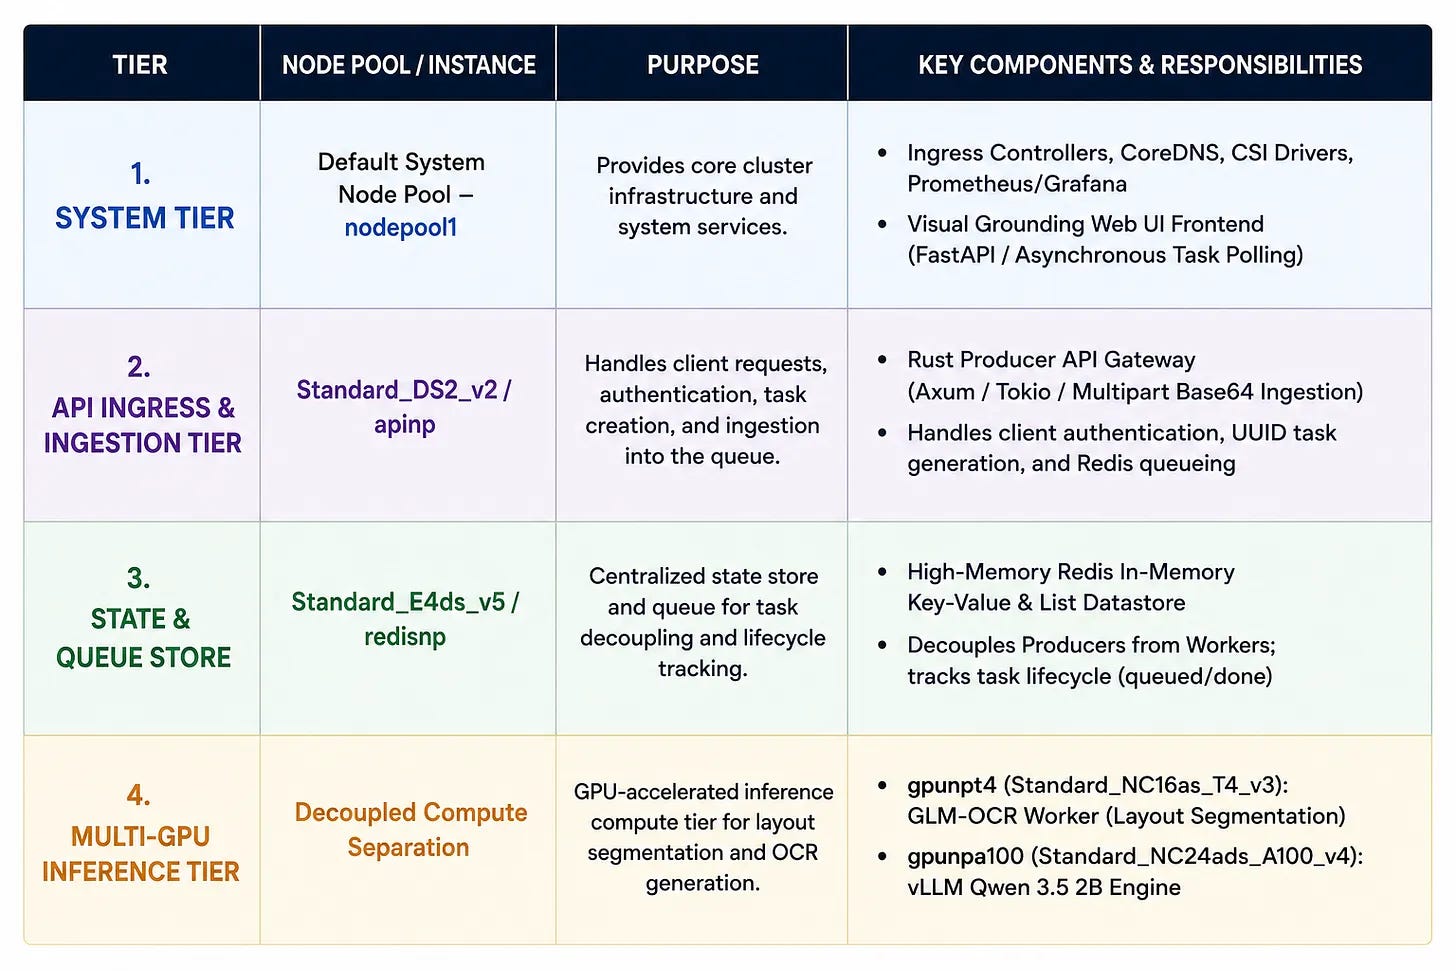
Why two separate GPU pools?
Because our pipeline has two stages, and they want completely different hardware.
Stage A: finding things (T4). Layout segmentation with PP-DocLayoutV3 is convolutional feature extraction over raw pixels. It's compute-light and needs only 2–4 GB of VRAM, but it's hungry for CPU alongside it to rasterise and normalise pages. A T4 with 16 vCPUs (Standard_NC16as_T4_v3) chews through this cheaply and at high volume.
Stage B: reading things (A100). Once you know where the tables and formulas are, reading them means autoregressive generation through a Vision-Language Model. That's a different bottleneck: large KV cache, high memory bandwidth. This is what an A100 with vLLM, PagedAttention and continuous batching exists for.
Put both stages on the A100 and you're renting the most expensive VRAM in the catalogue to run OpenCV image crops next to your KV cache. Split them, and each tier scales on its own signal.
🏆 This is the golden rule from Lesson 1 applied to a real pipeline: never colocate cheap work with expensive work.
Hands-on Lab
All deployment assets live under the week5_async_architecture_deployment directory. Let's walk the four moving parts.
1. The Rust producer
At the edge we run a small axum + tokio service with exactly one job: take the upload, put it in Redis, push the ID onto the queue, and get out of the way.
From client_rt_producer/src/main.rs:
async fn submit_task(
    State(state): State<Arc<AppState>>,
    mut multipart: Multipart,
) -> Result<impl IntoResponse, (StatusCode, String)> {
    let mut conn = state.redis_client.get_async_connection().await
        .map_err(|e| (StatusCode::INTERNAL_SERVER_ERROR, e.to_string()))?;

    let task_id = Uuid::new_v4().to_string();

    while let Some(field) = multipart.next_field().await
        .map_err(|e| (StatusCode::BAD_REQUEST, e.to_string()))?
    {
        if field.name() == Some("file") {
            let filename = field.file_name().unwrap_or("unknown.pdf").to_string();
            let extension = filename.split('.').last().unwrap_or("pdf").to_string();
            let data = field.bytes().await
                .map_err(|e| (StatusCode::BAD_REQUEST, e.to_string()))?;

            let base64_data = general_purpose::STANDARD.encode(&data);
            let task_key = format!("task:{}", task_id);

            // Write the ENTIRE task state in one command, before anyone can see the ID
            let _: () = redis::cmd("HSET")
                .arg(&task_key)
                .arg("status").arg("queued")
                .arg("filename").arg(&filename)
                .arg("extension").arg(&extension)
                .arg("data").arg(&base64_data)
                .query_async(&mut conn)
                .await
                .map_err(|e| (StatusCode::INTERNAL_SERVER_ERROR, e.to_string()))?;

            // ONLY NOW does the task become visible to workers
            let _: () = conn.lpush("ocr_tasks", &task_id).await
                .map_err(|e| (StatusCode::INTERNAL_SERVER_ERROR, e.to_string()))?;

            return Ok((StatusCode::ACCEPTED, Json(TaskResponse {
                task_id,
                status: "queued".to_string(),
            })));
        }
    }

    Err((StatusCode::BAD_REQUEST, "Missing 'file' field in multipart form".to_string()))
}
Two decisions in there are worth slowing down on.
The order of those two commands is not arbitrary. We write the full state hash first, then push the ID to the queue. Flip it and you've built a race: a fast worker pops the ID, looks up task:<id>, finds a half-written hash, and fails on a document that was perfectly fine. Using a single multi-argument HSET means the hash is never partially visible.
👉 The rule: nothing goes on the queue until the thing it points at is completely ready.
The 202 Accepted is the contract. We're not saying "here's your result." We're saying "we have your document, here's your ticket." The connection closes in under 5 ms, and no proxy anywhere in the chain has anything to time out.
Then the status route, which clients poll:
async fn get_status(
    State(state): State<Arc<AppState>>,
    Path(task_id): Path<String>,
) -> Result<impl IntoResponse, (StatusCode, String)> {
    let mut conn = state.redis_client.get_async_connection().await
        .map_err(|e| (StatusCode::INTERNAL_SERVER_ERROR, e.to_string()))?;

    let task_key = format!("task:{}", task_id);
    let exists: bool = conn.exists(&task_key).await
        .map_err(|e| (StatusCode::INTERNAL_SERVER_ERROR, e.to_string()))?;

    if !exists {
        return Err((StatusCode::NOT_FOUND, "Task ID not found".to_string()));
    }

    let data: HashMap<String, String> = conn.hgetall(&task_key).await
        .map_err(|e| (StatusCode::INTERNAL_SERVER_ERROR, e.to_string()))?;

    let status = data.get("status").cloned().unwrap_or_else(|| "unknown".to_string());
    let result_raw = data.get("result").cloned();
    let error = data.get("error").cloned();
    let result = result_raw.and_then(|r| serde_json::from_str(&r).ok());

    Ok(Json(StatusResponse { task_id, status, result, error }))
}
This is a single in-memory hash read, so it returns in well under a millisecond. Hundreds of clients can poll continuously and the GPU workers never notice. That's the whole point of keeping task state separate from task execution.
🤔 "Why is the file itself in Redis?" Fair question. Redis is not a blob store. For a course-scale lab it keeps the moving parts down to one, and we purge the payload the instant inference succeeds (more on that below). Past roughly 10 MB per document or high sustained ingestion, put the bytes in Azure Blob Storage and push only the blob URI through the queue. Same architecture, one less thing keeping your Redis node awake at night.
2. The Python consumer
On the compute side, a long-running daemon on the T4 pool (gpunpt4) pulls batches and drives the GLM-OCR pipeline. From client_rt_consumer/worker.py:
async def process_batch(task_ids):
    """Processes a batch of tasks together via the GLM-OCR SDK."""
    temp_paths = []
    valid_task_ids = []

    try:
        # 1. Stage the batch in Linux shared memory (/dev/shm)
        for task_id in task_ids:
            task_data = r.hgetall(f"task:{task_id}")
            if not task_data:
                continue

            r.hset(f"task:{task_id}", "status", "processing")

            file_bytes = base64.b64decode(task_data['data'])
            ext = task_data.get('extension', 'jpg')
            temp_path = f"/dev/shm/{task_id}.{ext}"

            with open(temp_path, "wb") as f:
                f.write(file_bytes)
            os.chmod(temp_path, 0o644)

            temp_paths.append(temp_path)
            valid_task_ids.append(task_id)

        if not temp_paths:
            return

        # 2. One dispatch for the whole batch (layout on T4, region OCR to vLLM)
        results = await asyncio.to_thread(ocr_engine.parse, temp_paths)

        if not isinstance(results, list):
            results = [results]

        # 3. Store the structured output, drop the payload
        for i, task_id in enumerate(valid_task_ids):
            if i >= len(results):
                break

            res_obj = results[i]
            markdown = getattr(res_obj, "markdown_result", "")
            layout = getattr(res_obj, "json_result", {})

            final_result = {"markdown": markdown, "layout": layout}

            r.hset(f"task:{task_id}", mapping={
                "status": "done",
                "result": json.dumps(final_result),
                "data": ""   # reclaim the base64 RAM immediately
            })

    except Exception as e:
        logger.error(f"❌ Batch processing failed: {e}")
        for task_id in valid_task_ids:
            r.hset(f"task:{task_id}", mapping={"status": "failed", "error": str(e)})
    finally:
        for path in temp_paths:
            if os.path.exists(path):
                os.remove(path)
Three things in there are doing real work.
Writing files to RAM instead of disk
/dev/shm looks like a directory. It isn't. It's tmpfs, a filesystem that lives entirely in RAM. Writing our decoded images there means the GLM-OCR loader reads them back at memory-bus speed, with no filesystem locks and no NVMe write latency in the path.
If that sounds familiar, it's the same mount we set up in Lesson 1 for PyTorch DataLoader tensors. Remember the catch: Kubernetes caps /dev/shm at 64 MB by default, and blowing past it gives you a bare Bus error (core dumped) with no explanation. You need the RAM-backed emptyDir volume:
volumeMounts:
  - mountPath: /dev/shm
    name: dshm
volumes:
  - name: dshm
    emptyDir:
      medium: Memory
      sizeLimit: 4Gi
Making sure the CPU never starves the GPU
Here's a trap that costs people a lot of money. You rent a GPU node, your GPU sits at 40% utilisation, and you conclude the GPU is the problem. It usually isn't. The CPU couldn’t decode and rasterise pages fast enough to keep it fed.
Standard_NC16as_T4_v3 gives us 16 vCPUs specifically so this doesn't happen. Four settings keep the pipeline balanced:
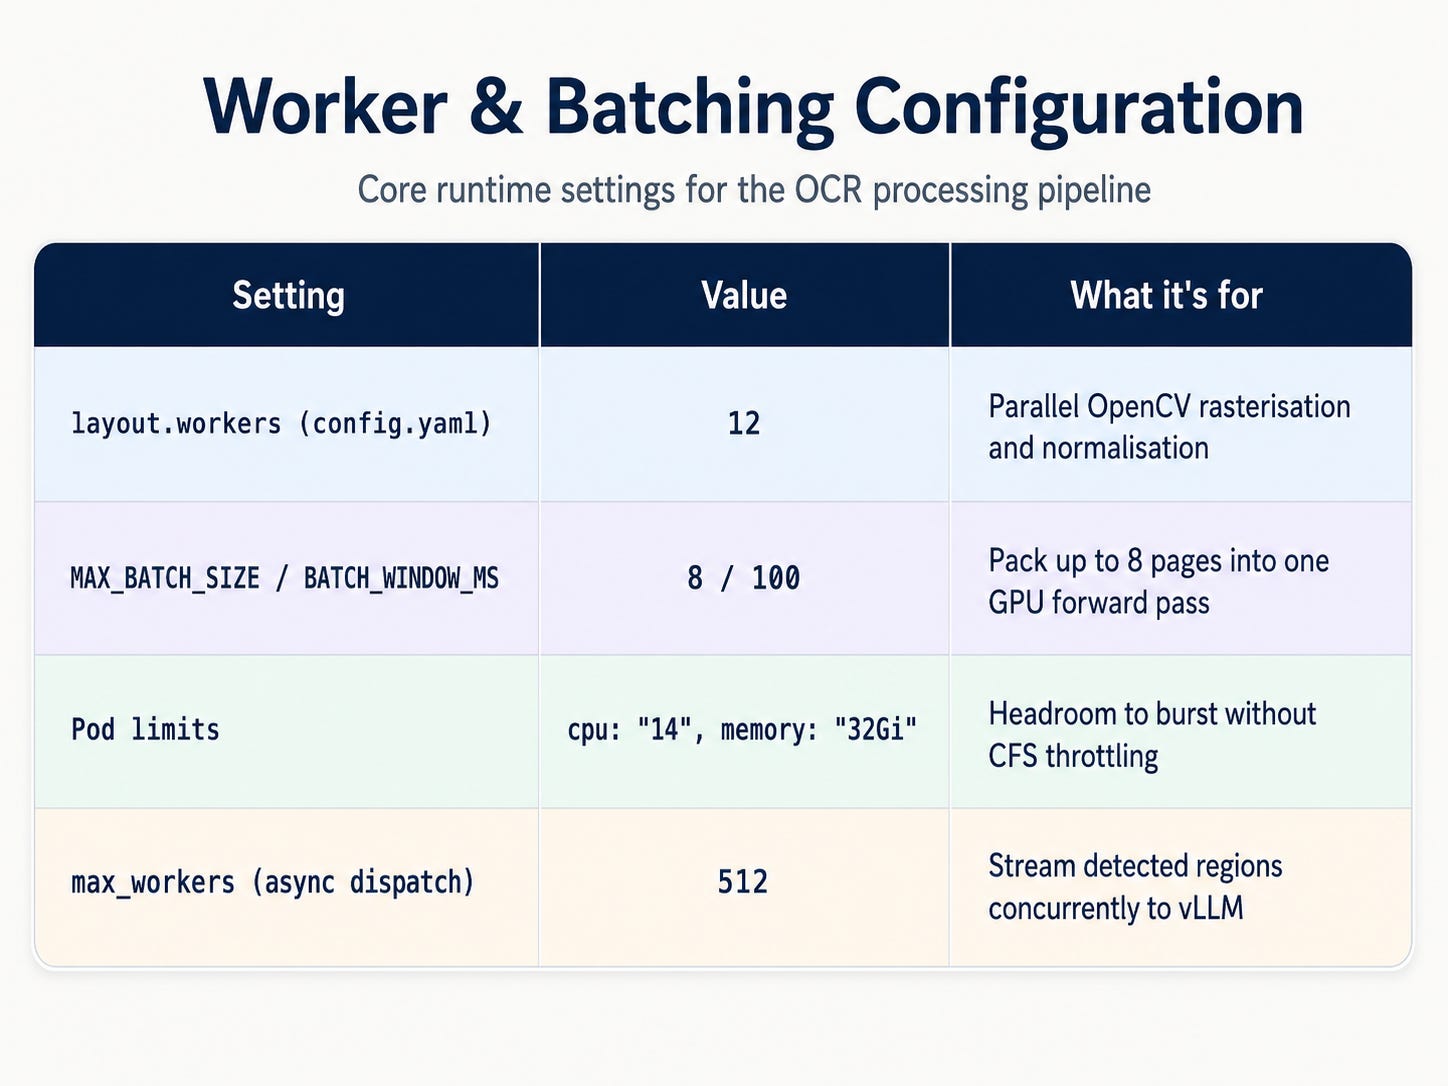
That last one matters more than it looks. Stage A finds regions much faster than Stage B can read them, so the dispatcher needs deep concurrency to keep the A100’s continuous batching queue full rather than trickling regions across one at a time.
Keeping Redis from eating itself
Look at the "data": "" on success. That's not cosmetic.
Base64 encoding inflates every payload by roughly 33%, and those strings sit in RAM. Under sustained ingestion, Redis memory grows linearly with everything you've ever processed until the node OOMs. Clearing the payload the moment we have a result keeps the lightweight JSON (which clients still need) and throws away the heavy part (which nobody needs again).
👉 In an async system, "who deletes the payload, and when?" is a design decision, not an afterthought. Consider a TTL on completed task hashes too, so results don't accumulate forever either.
3. Autoscaling on the queue, not the CPU
So how do we scale this worker tier when documents pour in?
Not with a standard Horizontal Pod Autoscaler. We covered why in Lesson 1, and this pipeline is the perfect illustration: CPU utilisation is a lagging indicator. By the time your workers hit 80% CPU, hundreds of documents are already backed up in Redis. HPA sees a busy, healthy system and does nothing while the backlog grows.
The queue is the signal. So we let KEDA read it directly, from k8s/apps/keda-scaler.yml:
apiVersion: keda.sh/v1alpha1
kind: ScaledObject
metadata:
  name: ocr-worker-rt-scaler
  namespace: default
spec:
  scaleTargetRef:
    name: ocr-worker-rt-deployment
  minReplicaCount: 0
  maxReplicaCount: 4          # matches the T4 pool's --max-count (1 GPU per pod)
  cooldownPeriod: 300
  pollingInterval: 15
  triggers:
    # 1. Keep one worker warm during business hours (avoids cold starts at 9am)
    - type: cron
      metadata:
        timezone: America/New_York
        start: 0 8 * * 1-5
        end: 0 18 * * 1-5
        desiredReplicas: "1"
    # 2. Scale on actual pending work
    - type: redis
      metadata:
        address: ocr-redis-service.default.svc.cluster.local:6379
        listName: ocr_tasks
        listLength: "1"       # target 1 queued task per replica
---
apiVersion: keda.sh/v1alpha1
kind: ScaledObject
metadata:
  name: ocr-vlm-scaler
  namespace: default
spec:
  scaleTargetRef:
    name: ocr-vlm-deployment
  minReplicaCount: 0
  maxReplicaCount: 4
  cooldownPeriod: 300
  pollingInterval: 10
  triggers:
    # Scale the A100 tier when vLLM itself starts queueing requests
    - type: prometheus
      metadata:
        serverAddress: http://prometheus-operated.monitoring.svc:9090
        metricName: vllm_num_requests_waiting
        threshold: '1'
        query: sum(vllm:num_requests_waiting{kubernetes_namespace="default"})
Three behaviours come out of this:
Scale to zero overnight. Empty queue, cron window closed → KEDA takes the deployment to 0 replicas, the AKS Cluster Autoscaler deallocates the underlying GPU VM, and your idle GPU spend for the night is $0. No queue, no pods, no bill.
Scale out the instant work arrives. A task hits
ocr_tasksand KEDA is already asking the cluster autoscaler for a node. Note that with a cold pool this still takes a few minutes: node provisioning, plus image pull, plus model load. That cron trigger exists precisely so your 9am users don’t eat that wait.Let each GPU tier scale on its own signal. The T4 workers scale on Redis queue depth. The A100 vLLM pods scale on
vllm:num_requests_waiting, which is vLLM telling you directly that it is the bottleneck. Two tiers, two independent signals, no guessing.⚠️ Keep
maxReplicaCounthonest. Each worker requests a whole GPU, so if you setmaxReplicaCount: 10against a node pool with--max-count 4, six pods will sitPendingforever waiting for hardware that can't exist. Match the two numbers.
4. Let AKS manage the GPU drivers
Historically, GPU workloads on Kubernetes meant installing the NVIDIA GPU Operator Helm chart, carving out privileged Pod Security Admission profiles, and babysitting daemonsets that compile kernel modules.
You mostly don't need to do that anymore. AKS-managed GPU node pools install and maintain the NVIDIA driver, the Kubernetes device plugin, and the DCGM metrics exporter for you. This is now Microsoft’s recommended path for most workloads:
# A100 80GB pool → vLLM server
az aks nodepool add \
  --resource-group $RESOURCE_GROUP \
  --cluster-name $AKS_NAME \
  --name gpunpa100 \
  --node-vm-size Standard_NC24ads_A100_v4 \
  --node-count 1 \
  --enable-cluster-autoscaler \
  --min-count 0 \
  --max-count 4 \
  --node-taints sku=gpunpa100:NoSchedule \
  --enable-managed-gpu=true

# T4 16GB pool → GLM-OCR layout worker
az aks nodepool add \
  --resource-group $RESOURCE_GROUP \
  --cluster-name $AKS_NAME \
  --name gpunpt4 \
  --node-vm-size Standard_NC16as_T4_v3 \
  --node-count 1 \
  --enable-cluster-autoscaler \
  --min-count 0 \
  --max-count 4 \
  --node-taints sku=gpunpt4:NoSchedule \
  --enable-managed-gpu=true
AKS bootstraps the official drivers, wires up the Container Device Interface, and registers nvidia.com/gpu capacity with the kubelet. Zero Helm charts, zero privileged daemonsets. You still get DCGM metrics for free, which is handy for the telemetry we'll wire up in Lesson 6.
📌 Two things to check before you copy-paste. Managed GPU node pools are still a preview feature, and there's no in-place upgrade path, so migrating an existing GPU pool means cordon, drain, and redeploy onto a new one. Also note that
--skip-gpu-driver-installwas retired in August 2025; if you do want to run the GPU Operator yourself, the flag is now--gpu-driver none. Confirm the current CLI surface in the AKS docs before provisioning.
Guarding the Perimeter
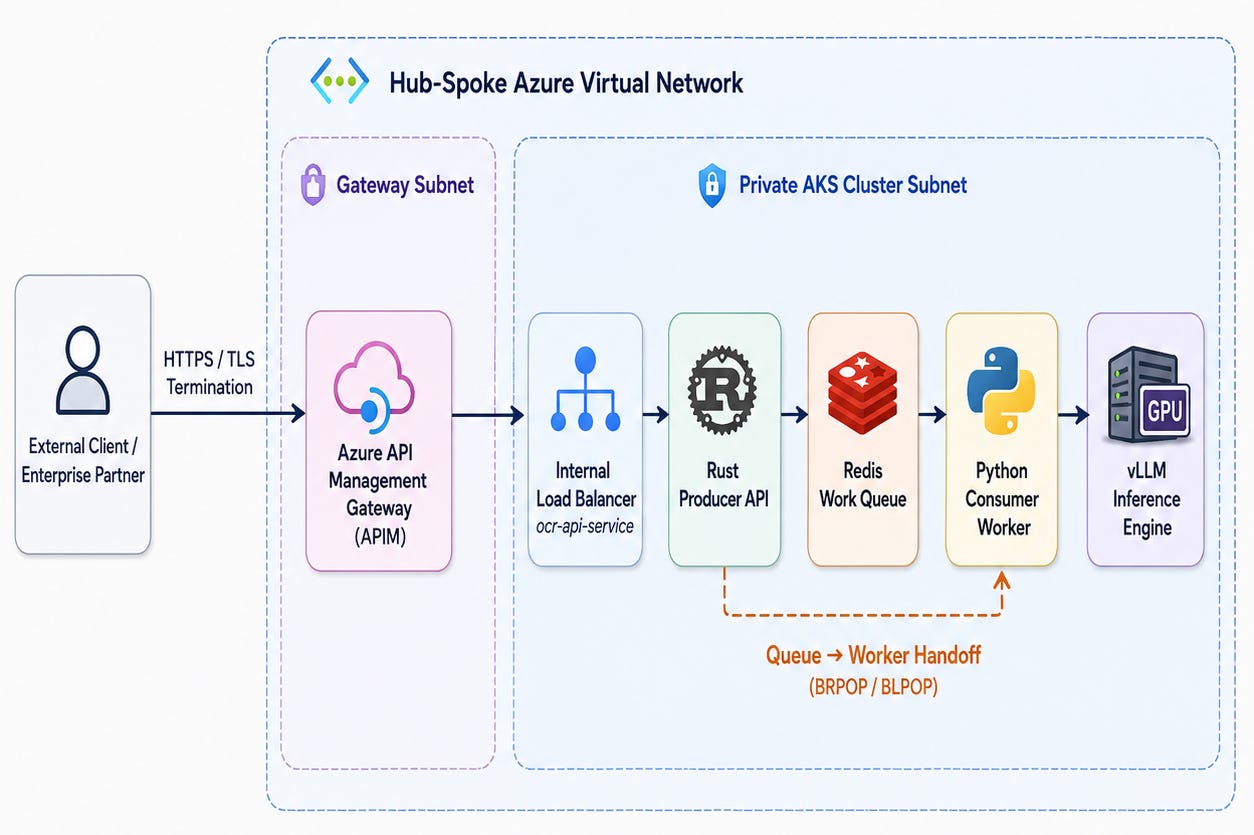
We have one problem left, and it's the expensive kind.
Everything we just built responds to demand automatically. Which means anybody who can reach /process can spend your money. A single loop in a shell script (no exploit, no cleverness, just curl in a while) floods the queue, KEDA does exactly what we told it to, and your A100 pool scales to maximum. That's thousands of dollars in minutes, from a script that isn’t even malicious, just badly written.
👉 Autoscaling turns a traffic bug into a billing incident. The perimeter is where you stop it.
The fix is two parts: make the cluster unreachable from the internet, then put one governed door in front of it.
Part 1: Take the gateway off the internet
Our Service in k8s/networking/service.yml carries one critical annotation:
apiVersion: v1
kind: Service
metadata:
  name: ocr-api-service
  namespace: default
  annotations:
    service.beta.kubernetes.io/azure-load-balancer-internal: "true"
spec:
  selector:
    app: ocr-api
  ports:
    - protocol: TCP
      port: 80
      targetPort: 5000
  type: LoadBalancer
That annotation tells Azure to provision the load balancer on a private IP inside the VNet. The Rust gateway now has no public exposure whatsoever. It cannot be reached from the internet at all, only from inside the virtual network.
Part 2: One governed door
Azure API Management sits in that same VNet and becomes the only public entrance. We register the two operations our async lifecycle needs:
# Submission
az apim api operation create \
  --resource-group $RESOURCE_GROUP \
  --service-name "apim-ocr-service" \
  --api-id "ocr-api" \
  --url-template "/process" \
  --method "POST" \
  --display-name "Submit OCR Task"

# Status polling
az apim api operation create \
  --resource-group $RESOURCE_GROUP \
  --service-name "apim-ocr-service" \
  --api-id "ocr-api" \
  --url-template "/status/{task_id}" \
  --method "GET" \
  --display-name "Get OCR Task Status"
And then the part that actually protects the GPUs: a policy that runs before any request reaches the VNet:
<!-- k8s/networking/apim-policy.xml -->
<policies>
    <inbound>
        <base />
        <!-- 1. Token bucket rate limit, keyed per subscription -->
        <rate-limit-by-key calls="100" renewal-period="60"
                           counter-key="@(context.Request.Headers.GetValueOrDefault("Ocp-Apim-Subscription-Key", context.Request.IpAddress))" />

        <!-- 2. Reject oversized uploads at the edge -->
        <validate-content unspecified-content-action="Allow"
                          max-size="10485760"
                          size-exceeded-action="Prevent" />
    </inbound>
    <backend><base /></backend>
    <outbound><base /></outbound>
    <on-error><base /></on-error>
</policies>
Here's why this is the highest-leverage config in the entire lesson. Follow the chain backwards:
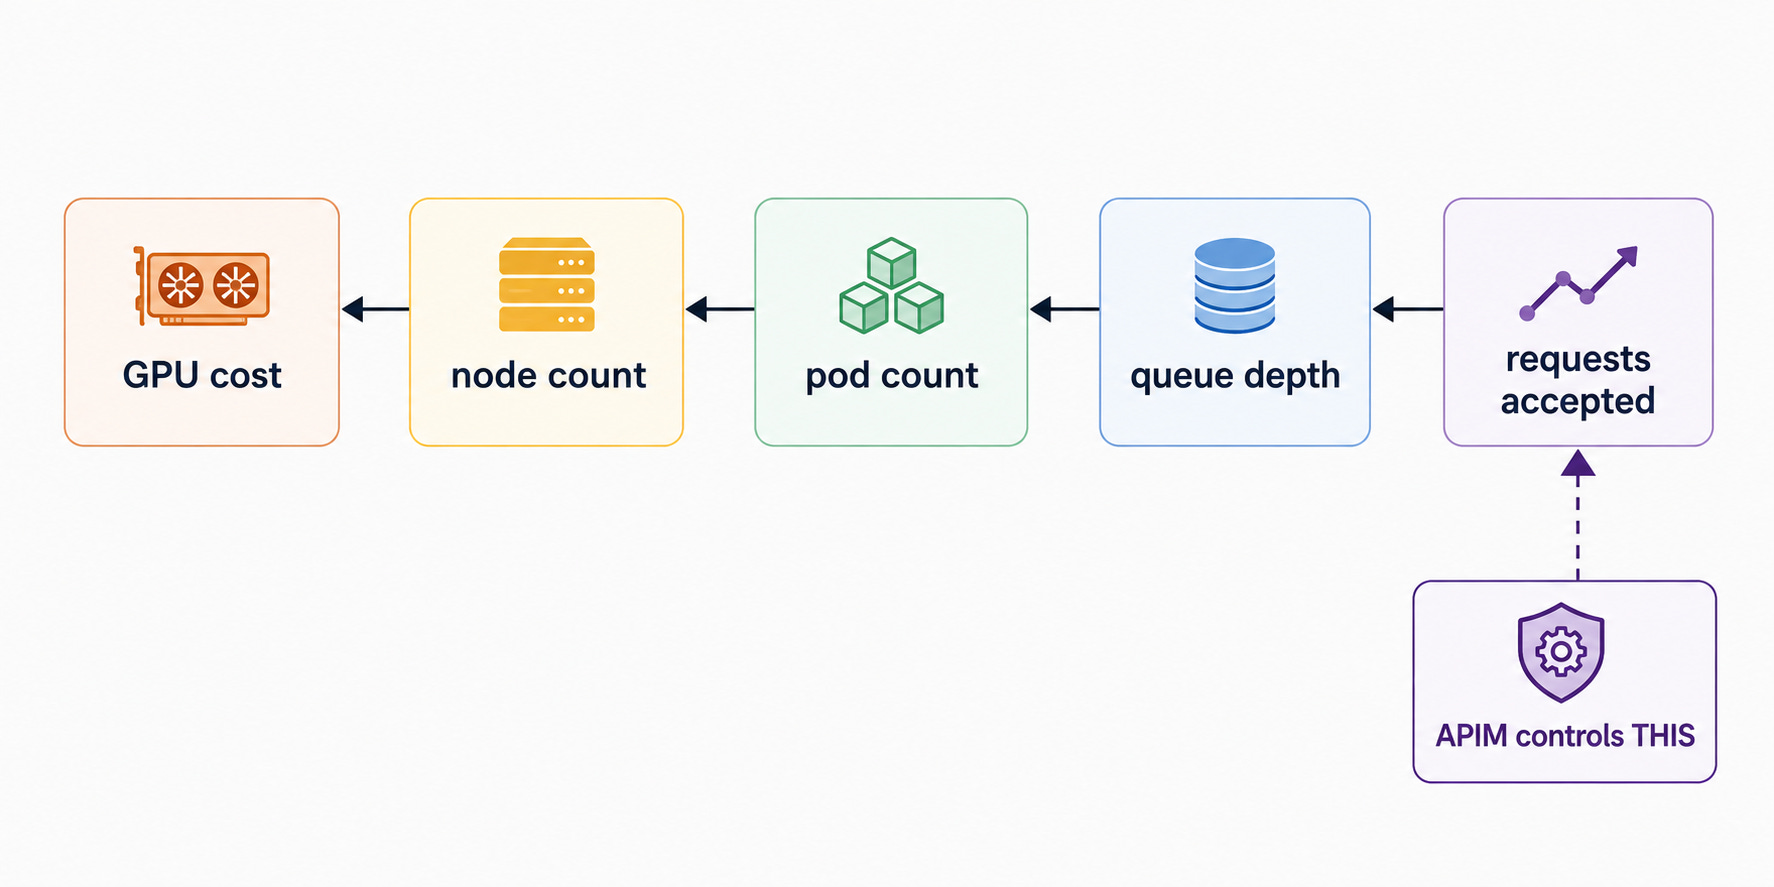
APIM doesn't know anything about GPUs. It doesn't need to. By capping each subscription key at 100 requests per minute, it caps how fast the queue can grow, which caps how many pods KEDA asks for, which caps how many GPU nodes Azure provisions. Excess traffic gets an HTTP 429 at the cloud gateway, before it ever touches Redis.
That's indirect GPU protection: you never write a rule about GPUs, you just control the tap upstream of them.
📌 Note that 10 MB ceiling matches the Axum gateway limit from Lesson 4. The two are deliberately in agreement, which is exactly what you want. It does mean the 120-page audit report from our opening example is out of scope as a single POST. When a customer needs it, you have two clean paths: raise both limits together and size Redis (or move payloads to Blob Storage), or switch to pre-signed upload URLs so large files bypass APIM entirely and only a blob URI travels through the queue. Change it on purpose, in both places.
