


Hi everyone!
This is the first lesson in our six-week course on building a production OCR system. If you've been part of The Neural Maze community for a while, you probably know my perspective:
A large language model or a deep learning model is not a final product but merely an initial stage.
Let me make it clear. It's excellent to run a PyTorch model in a Jupyter notebook or to use a FastAPI script within a local Docker container. Such an approach is ideal for prototyping and debugging on your laptop.
But most people don't tell you this: the simple single-container setup quickly fails as soon as you move from 'works on my machine' to serving thousands of users at the same time. I mean, in production, AI workloads can become complicated very quickly.
This article serves as a comprehensive masterclass for engineers who already understand Docker and REST APIs and who need to gain expertise in Kubernetes if they are to serve production AI workloads.
Let's get started!👇
💻 The production OCR code is open-source. Support our work by dropping a friendly ⭐ on the repo!
Docker vs Kubernetes
When building applications with Docker, your mental model is host-centric. You think about a single virtual machine (VM) running an isolated Linux container engine.
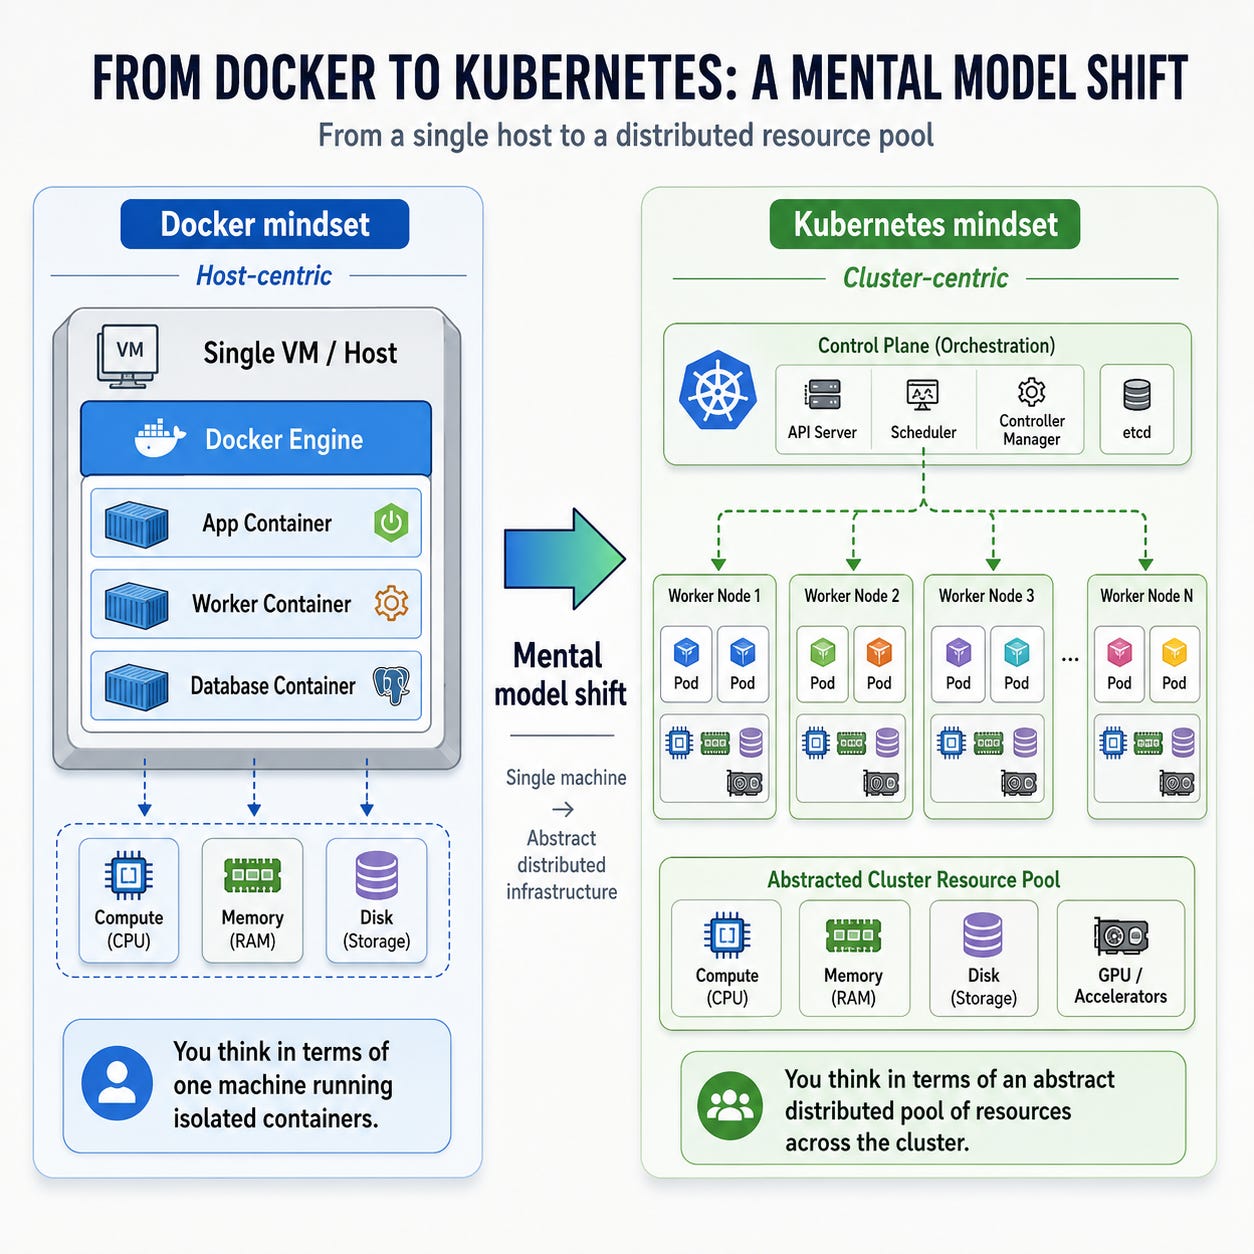
Kubernetes shifts your mental model from a single machine to an abstract distributed pool of compute, memory, disk, and specialized hardware accelerators.
This article assumes you have a decent understanding of Docker. If you're new to this technology, or if you want to refresh some concepts, I recommend you to check Fireship's 100 seconds introduction.
Now, here's how standard Docker concepts translate nto Kubernetes primitives (specifically tailored for ML systems):
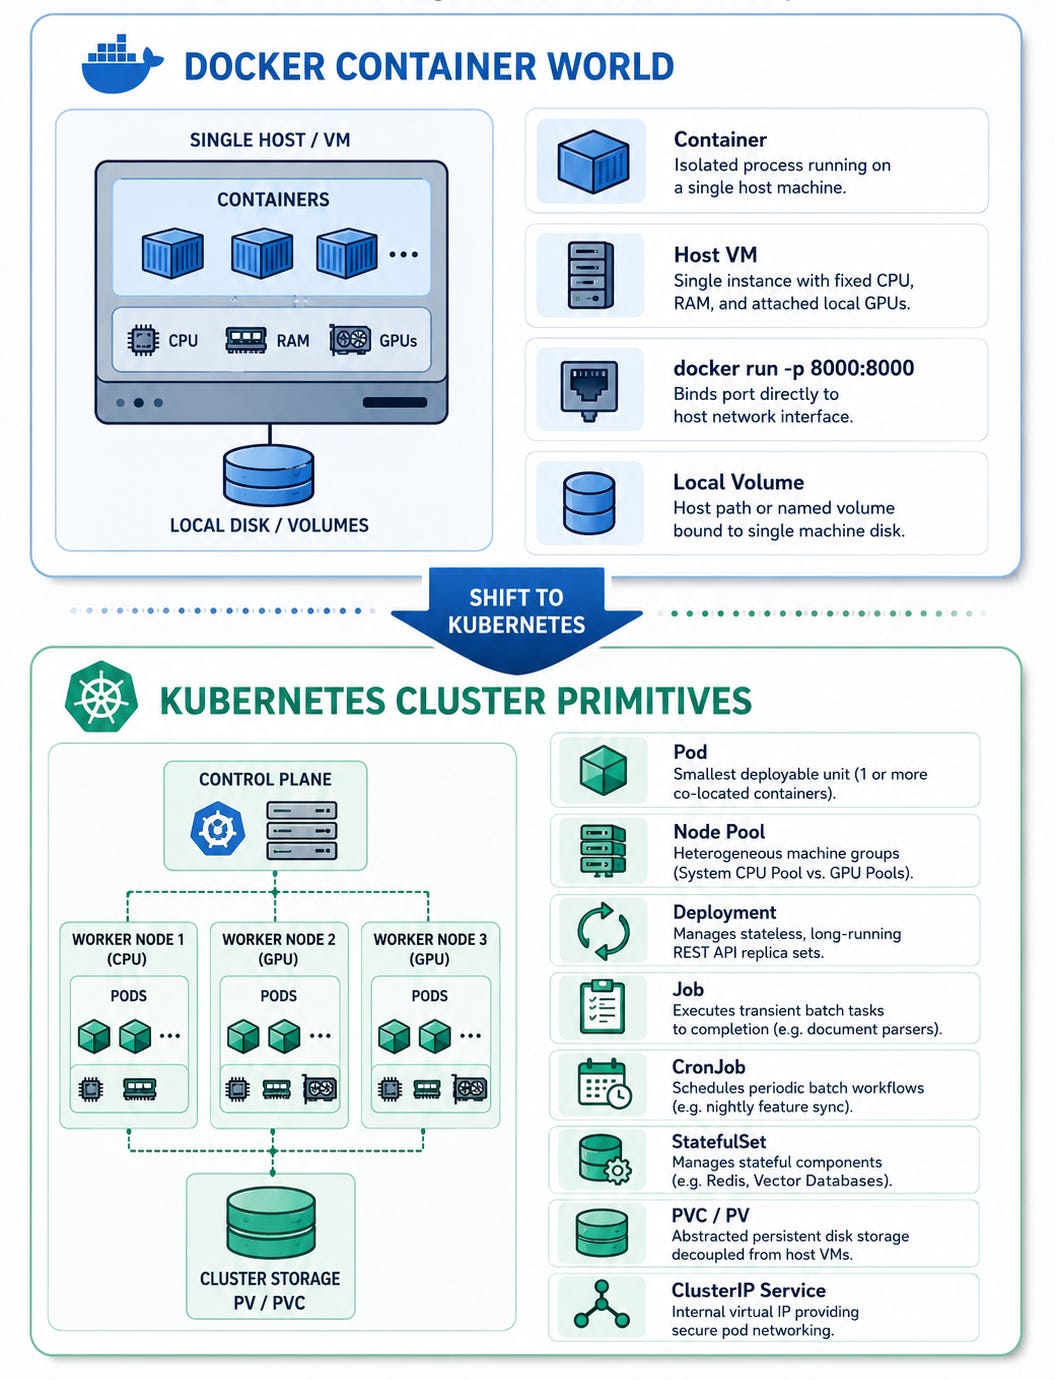
In Docker, the golden rule is "one process per container". In Kubernetes, on the other hand, the atomic unit of deployment is the Pod. A Pod encapsulates one or more containers that share:
The same network namespace: Which means they share an IP address and localhost
The same storage volumes: Which means they can read and write to shared memory partitions / local disk volumes
The same host scheduling assignment: Which means that all containers in a Pod are guaanteed to land on the exact some physical node
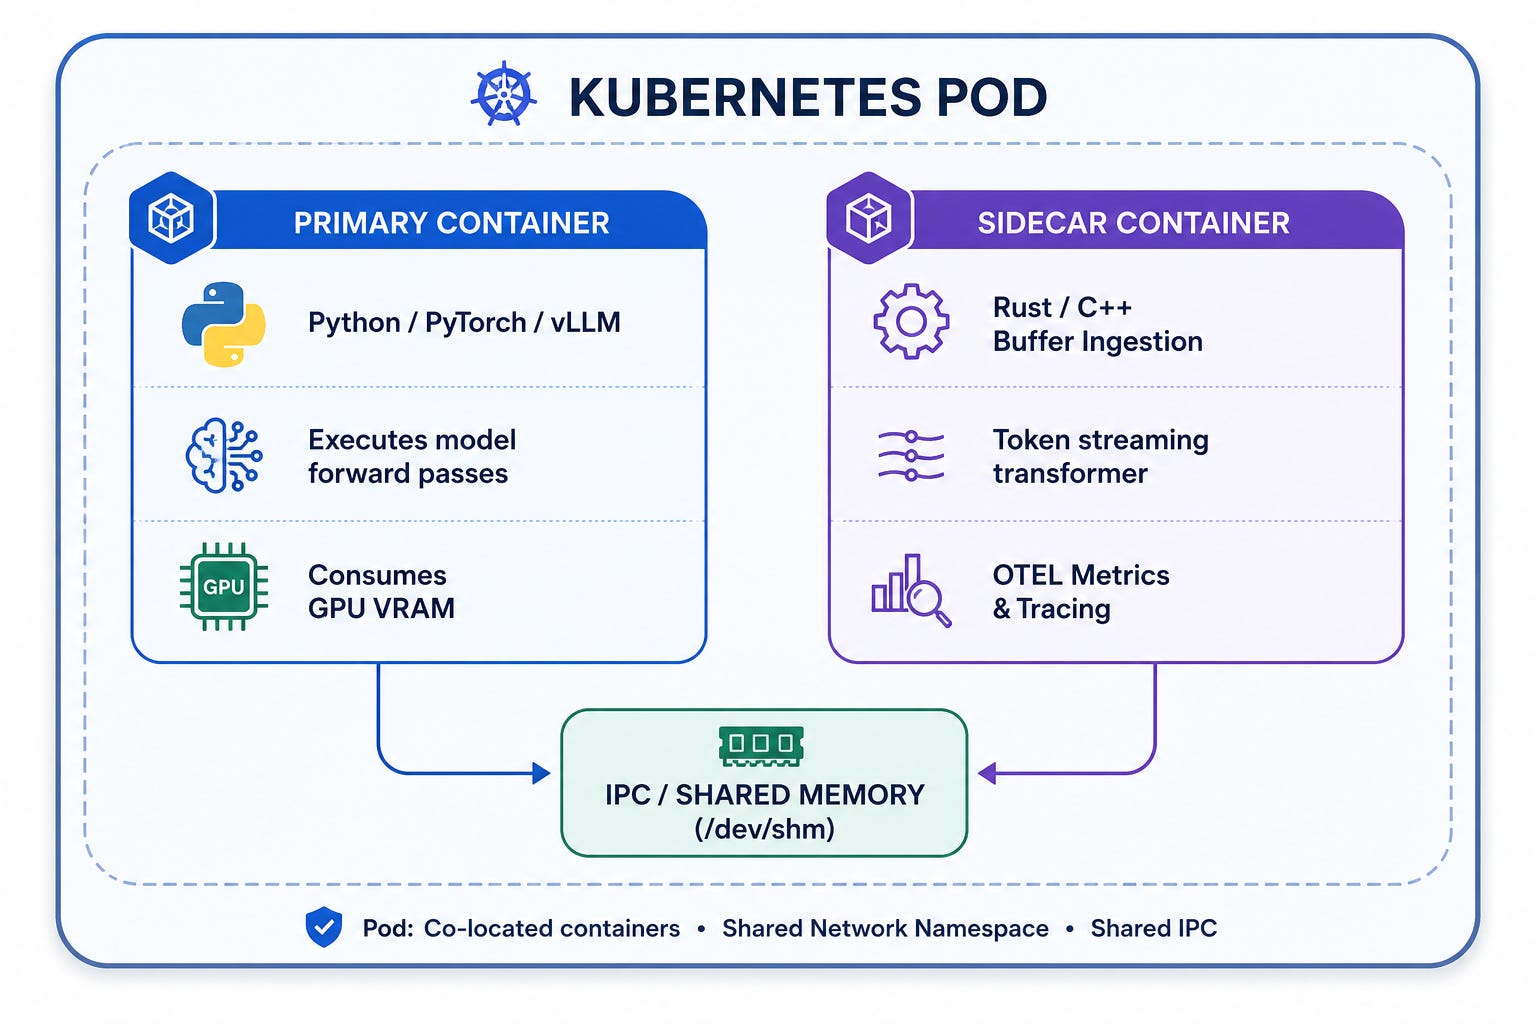
This multicontainer Pod structure allows you to keep your ML inference engine clean while offloading tasks such as pre-processing, authentication, observability, …. to lightweight sidecar containers written in more efficient languages, like Rust, Go, or C++.
Deployments vs Batch Jobs & ML Pipelines
A major source of confusion for engineers entering Kubernetes is knowing which workload controller to select for a given task. In Machine Learning platforms, workloads typically fall into two broad categories.
Category 1: Continuous Services
The first type of workload controller that you need to understand is the Deployment, since it is used for stateless microservices and inference engines. This refers to long-running, continuous HTTP or gRPC servers which never terminate; examples include FastAPI routing gateways, vLLM inference runtimes, and embedding endpoints. What’s nice about deployments is that they allow you to control the number of replicas, enable automated pod self-healing in the event that a pod dies, and permit zero-downtime rolling updates via settings such as maxSurge and maxUnavailable.
We come to StatefulSets, the ones you should choose whenever persistent state and storage are involved. Unlike deployments, StatefulSets are used for continuous workloads that require stable network identifiers and, most important of all, their own separate persistent disks. It is for this kind of setup that you will create instances for Redis task queues, Neo4J knowledge graph stores, or your own self-hosted vector database.
Category 2: Transient Batch Tasks (Jobs & CronJobs)
This is the second category, consisting of tasks which are not expected to continue indefinitely. Batch tasks carry out a specific payload and must end cleanly when they have completed. Here are two examples:
Kubernetes Job (run-to-completion task)
A job creates one or more pods and ensures that a specified number of them successfully terminate:
apiVersion: batch/v1
kind: Job
metadata:
  name: offline-embedding-batch
spec:
  completions: 1        # Must complete successfully once
  parallelism: 1        # Runs 1 pod in parallel
  backoffLimit: 3       # Retries up to 3 times on failure
  ttlSecondsAfterFinished: 300 # Automatically cleans up completed Pod 5 mins later
  template:
    spec:
      restartPolicy: Never
      containers:
        - name: batch-embedder
          image: tnm/batch-embedder:v1
          command: ["python", "process_documents.py"]
Kubernetes CronJob (scheduled periodic task)
A cronjob executes a job on a time-based schedule (with the standard 5-field cron syntax):
apiVersion: batch/v1
kind: CronJob
metadata:
  name: nightly-feature-store-sync
spec:
  schedule: "0 2 * * *" # Runs every night at 2:00 AM UTC
  concurrencyPolicy: Forbid # Prevents overlapping executions if previous job is slow
  jobTemplate:
    spec:
      template:
        spec:
          restartPolicy: OnFailure
          containers:
            - name: feature-sync
              image: tnm/feature-sync:v1
How to orchestrate ML Pipelines
Now that we understand the two types of workloads, the question is: "how can we apply these concepts to real-world ML Systems?".
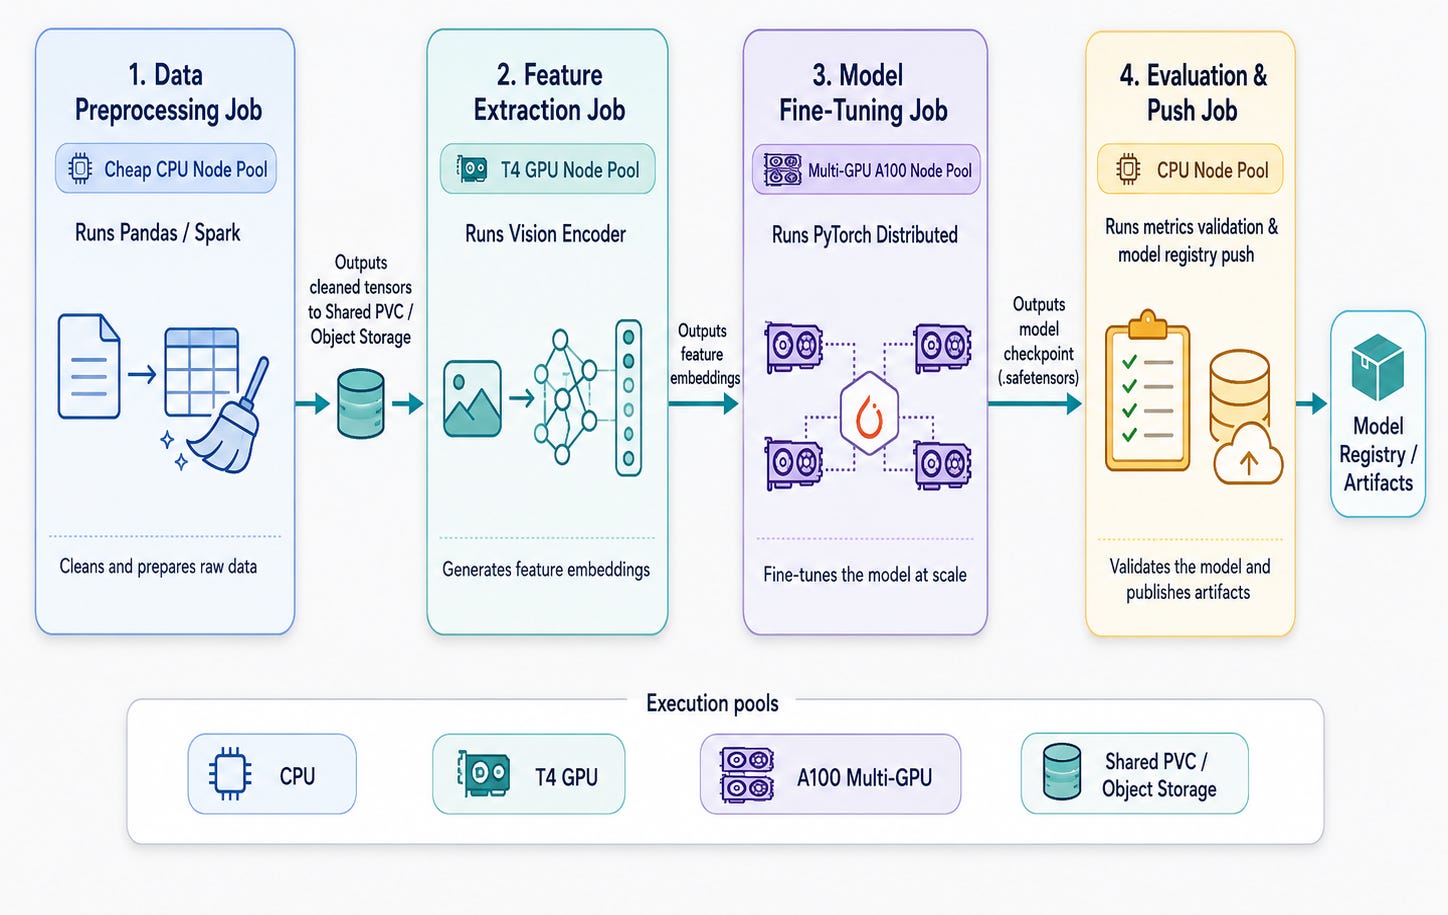
Well, for that scenario, single jobs are not enough. Why? Because ML workflows are multi-stage pipelines structured as Directed Acyclic Graphs (DAGs) (check the image below).
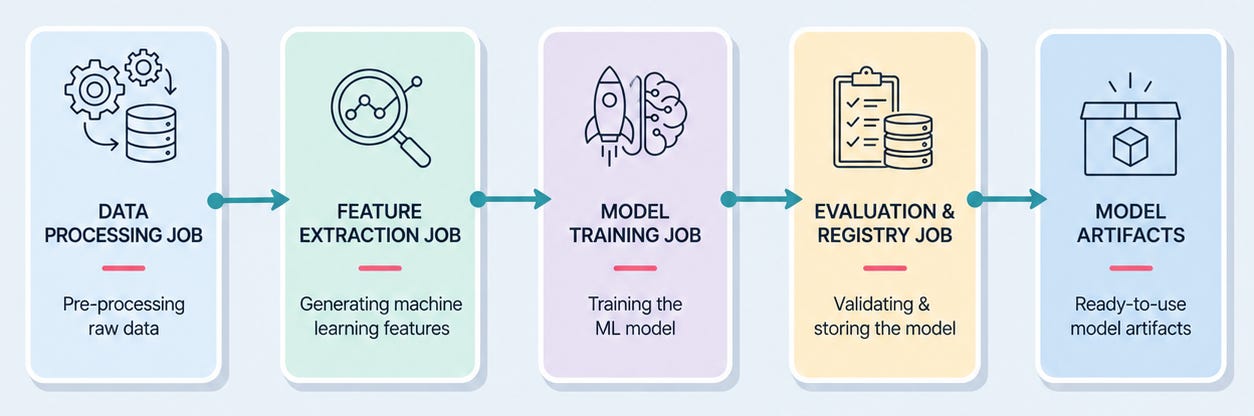
Luckily for us, tools like Kubeflow Pipelines (KFP) and Argo Workflows are native Kubernetes custom controllers (CRDs), which means they can orchestrate multi-step ML workflows where each node in the pipeline is executed as an isolated Kubernetes Job or pod step:
Kubernetes Networking Models
Time to get into networking! Networking in Kubernetes is engineered around a single, strict principle: least privilege access. Which means that, by default, our microservices are kept securely isolated from the public internet by default.
Now, take a look at the diagram below:
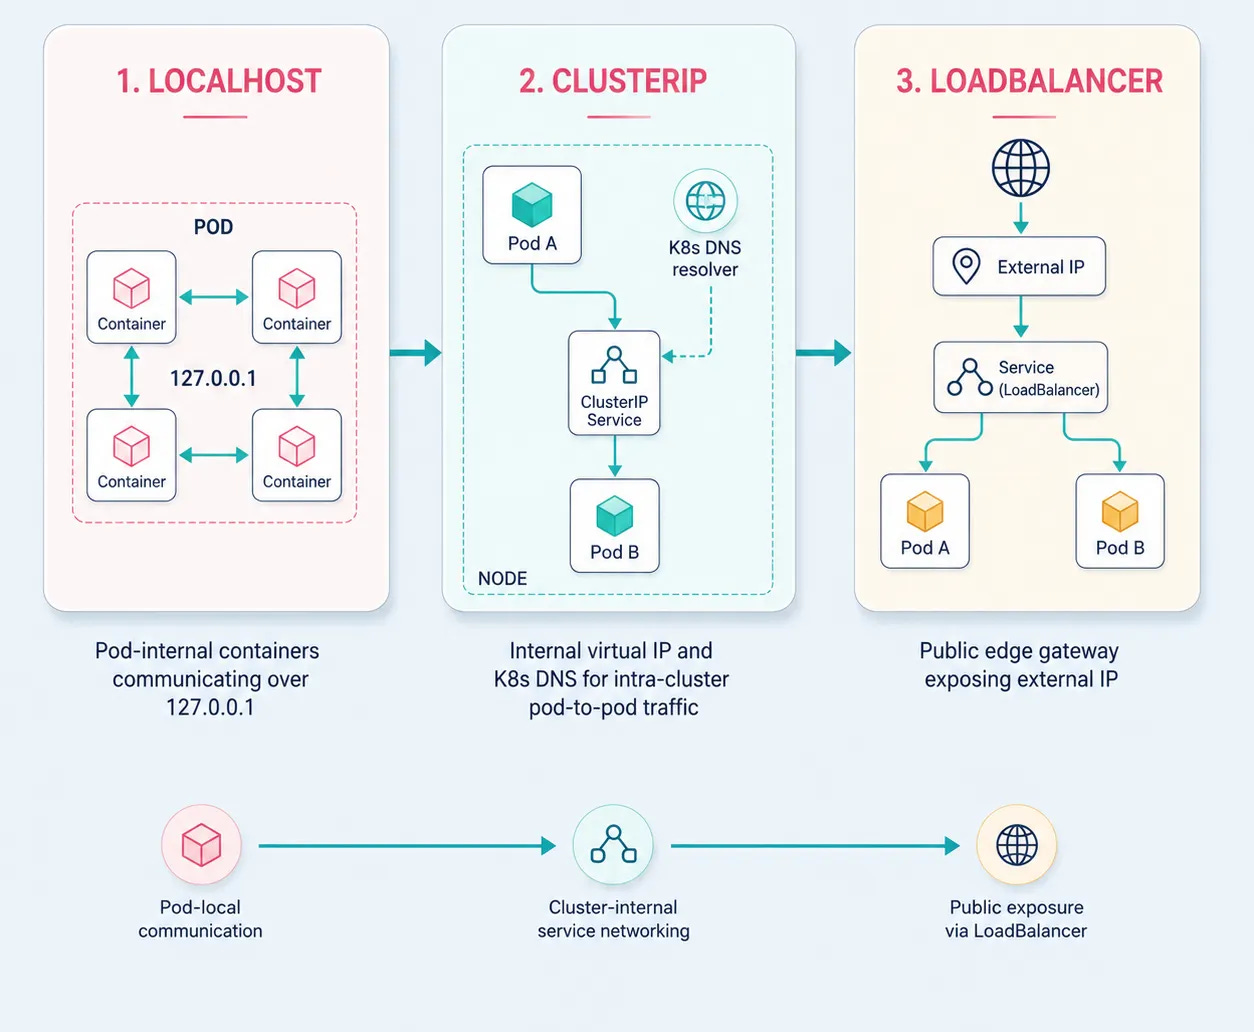
The three blocks you see in the diagram are the three fundamental communication scopes making up Kubernetes networking. It's important to understand how they work together, and when each one should be used, so that your AI backend can remain both fast and secure.
The first option is localhost, and it is used for communication between containers within a single Pod. If containers are situated in the same Pod, then they communicate with one another via 127.0.0.1. The latency in this case is less than one millisecond because the communication takes place over an in-memory socket on the loopback interface. A typical example of its use would be a Rust API wrapper making a call to a local Python inference process that is listening on 127.0.0.1:8000.
The next service type to consider is ClusterIP, the default Kubernetes service type, which provides an internal virtual IP address and cluster-wide DNS. It assigns an internal, non-routable virtual IP address and records a DNS name in the format http://<service-name>.<namespace>.svc.cluster.local:<port>.
The important point here is its scope: the service can only be accessed by other Pods and Jobs that are running within the cluster. And that is precisely why it is so important when it comes to AI backends. Raw model endpoints such as PyTorch servers, Triton inference instances, or vLLM deployments should never be made directly accessible over the public internet using a public IP address, because doing so would invite unauthorized inference billing, DDoS attacks, and rate-limit exhaustion. ClusterIP ensures that your model pods can only be accessed by authenticated internal gateways or batch worker jobs.
Lastly, the public edge layer is managed by the LoadBalancer and the Ingress. The LoadBalancer requests your cloud provider (for example, Azure) to allocate an external public IP address. Then, the Ingress, or the Gateway API, is placed on top to handle the external HTTP/HTTPS routing rules, the termination of SSL/TLS, and dispatching based on paths, so that a request to /v1/chat/completions is directed to your LLM service while one to /v1/embeddings is sent to the embedding service.
Kubernetes Storage Architecture
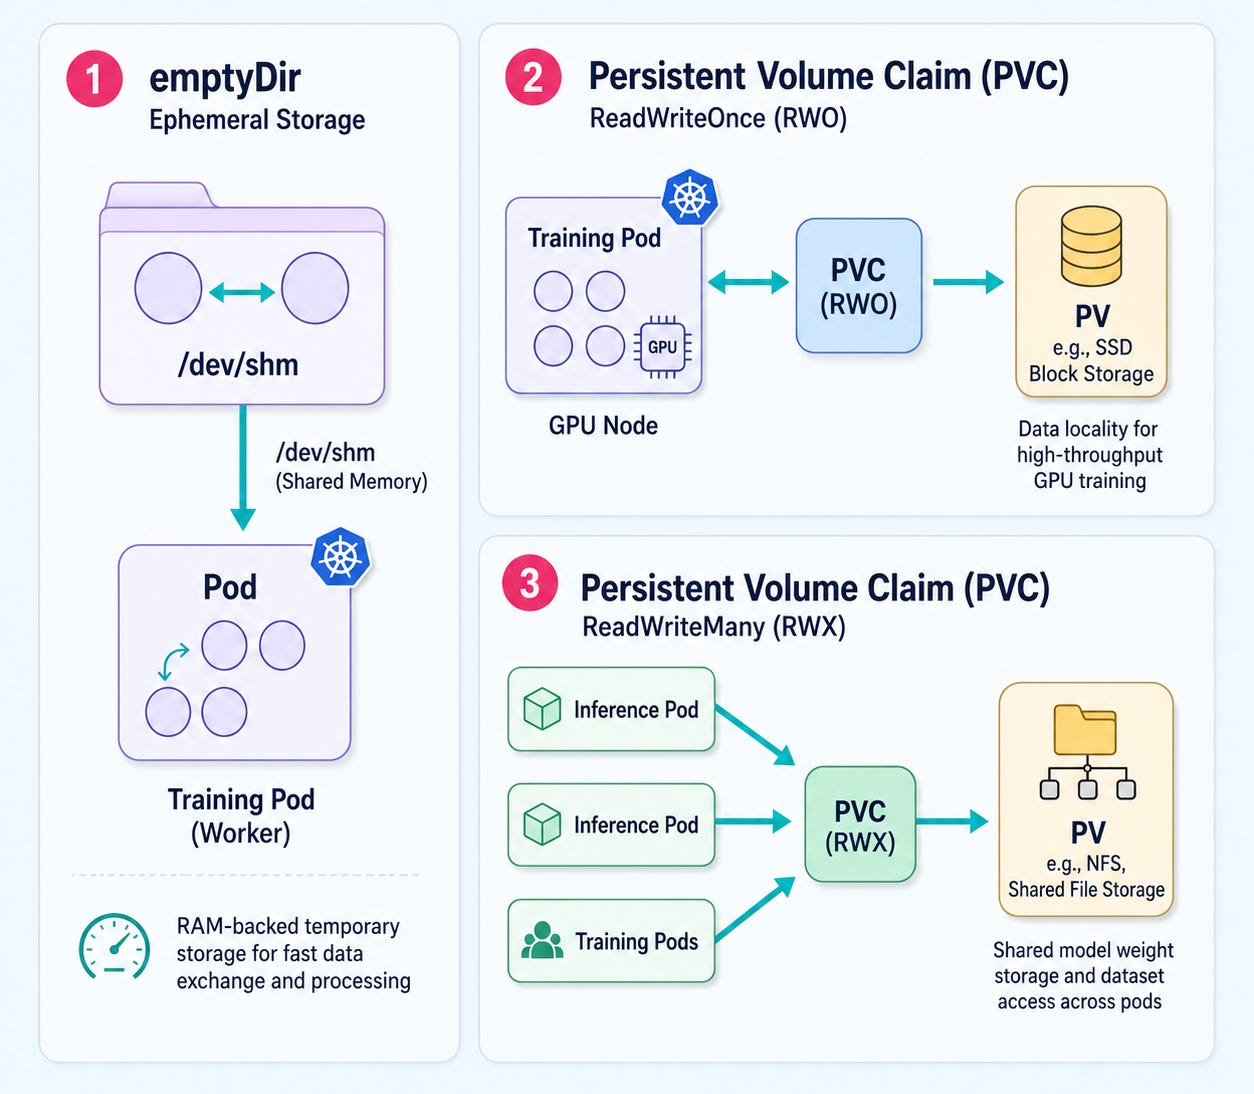
In Kubernetes, storage is decoupled from your worker nodes. And for machine learning workloads specifically, the storage architecture you pick directly affects your startup latencies, tensor throughput, and overall system reliability. Having said that, it's clear why it's worth getting this part right.
There are a few options to know.
The first one is ephemeral scratch storage. Its lifecycle is tied directly to the pod, meaning it's created when the pod is scheduled and destroyed when the pod is deleted. You can back it with a standard disk or by RAM. This is what we are using to mount POSIX shared memory (/dev/shm) so we can pass high-resolution image tensors between Dataloader subprocesses without hitting disk I/O bottlenecks.
The next items are Persisten Volume Claims (PVCs) and StorageClasses. A PVC is a storage request made by a user, and a PersistentVolume is the actual underlying storage resource that Kubernetes sets up via a StorageClass. Examples are Azure Disk, AWS EBS, or GCP Persistent Disk. This is an example of a typical claim:
apiVersion: v1
kind: PersistentVolumeClaim
metadata:
  name: model-weights-pvc
spec:
  accessModes:
    - ReadWriteOnce # RWO: Single node mount
  storageClassName: managed-csi-premium # Premium SSD Storage
  resources:
    requests:
      storage: 100Gi
That brings us to access modes, and also the distinction between ReadWriteOnce (RWO) (used by the YAML above) and ReadWriteMany (RWM).
As the name implies, RWO can be mounted as read-write by a single node, which makes it ideal for high-speed local SSD storage (e.g. holding training checkpoints, vector DB data, etc.). RWX, on the other hand, can be mounted as read-write by many nodes at once, which is a good fit if you want a shared model weight cache, mounted across multiple GPU pods, for example.
And that last point leads us into an optimization tip worth remembering:
👉 Downloading a 30GB model from Hugging Face every singe time a GPU worker pod scaled up causes painfully cold-start delays (we are talking about 3 to 10 minutes!). BUT if you add a shared RWX PVC that already contains the pre-downloaded Safetensor weights … your newly scaled GPU pods start up in seconds instead. Big difference, right?
ConfigMaps and Secrets
In Kubernetes application the 12-factor app methodology is followed, with configuration being kept strictly separate from the code. In this section, you need to understand two concepts:
ConfigMap (non-sensitive configuration)
Stores environment variables, model execution parameters, or configuration files:
apiVersion: v1
kind: ConfigMap
metadata:
  name: vllm-runtime-config
data:
  MAX_MODEL_LEN: "8192"
  GPU_MEMORY_UTILIZATION: "0.90"
  TENSOR_PARALLEL_SIZE: "1"
  LOG_LEVEL: "INFO"
Secret (sensitive credentials)
Stores API tokens, database passwords, or cloud storage keys securely (b64-encoded or integrated with external Key Vaults):
apiVersion: v1
kind: Secret
metadata:
  name: model-api-keys
type: Opaque
data:
  HUGGING_FACE_HUB_TOKEN: "aGZfMTIzNDU2Nzg5..." # Base64 encoded
  AZURE_OPENAI_API_KEY: "YXp1cmVfa2V5X2FiY..."
Your pods will consume both ConfigMaps and Secrets either as environment variables (envFrom) or mounted configuration files (volumeMounts).
Model Startup Lifecycles
With standard web microservices, a container gets up and running in less than 500 ms and immediately passes its health checks. But serving generative AI models? Well, that's a different game. The process of starting up a model is heavy and involves multiple stages, and when you're deploying a high-performance inference engine such as vLLM, loading the model into VRAM can take anywhere from 90s to even 5 min …
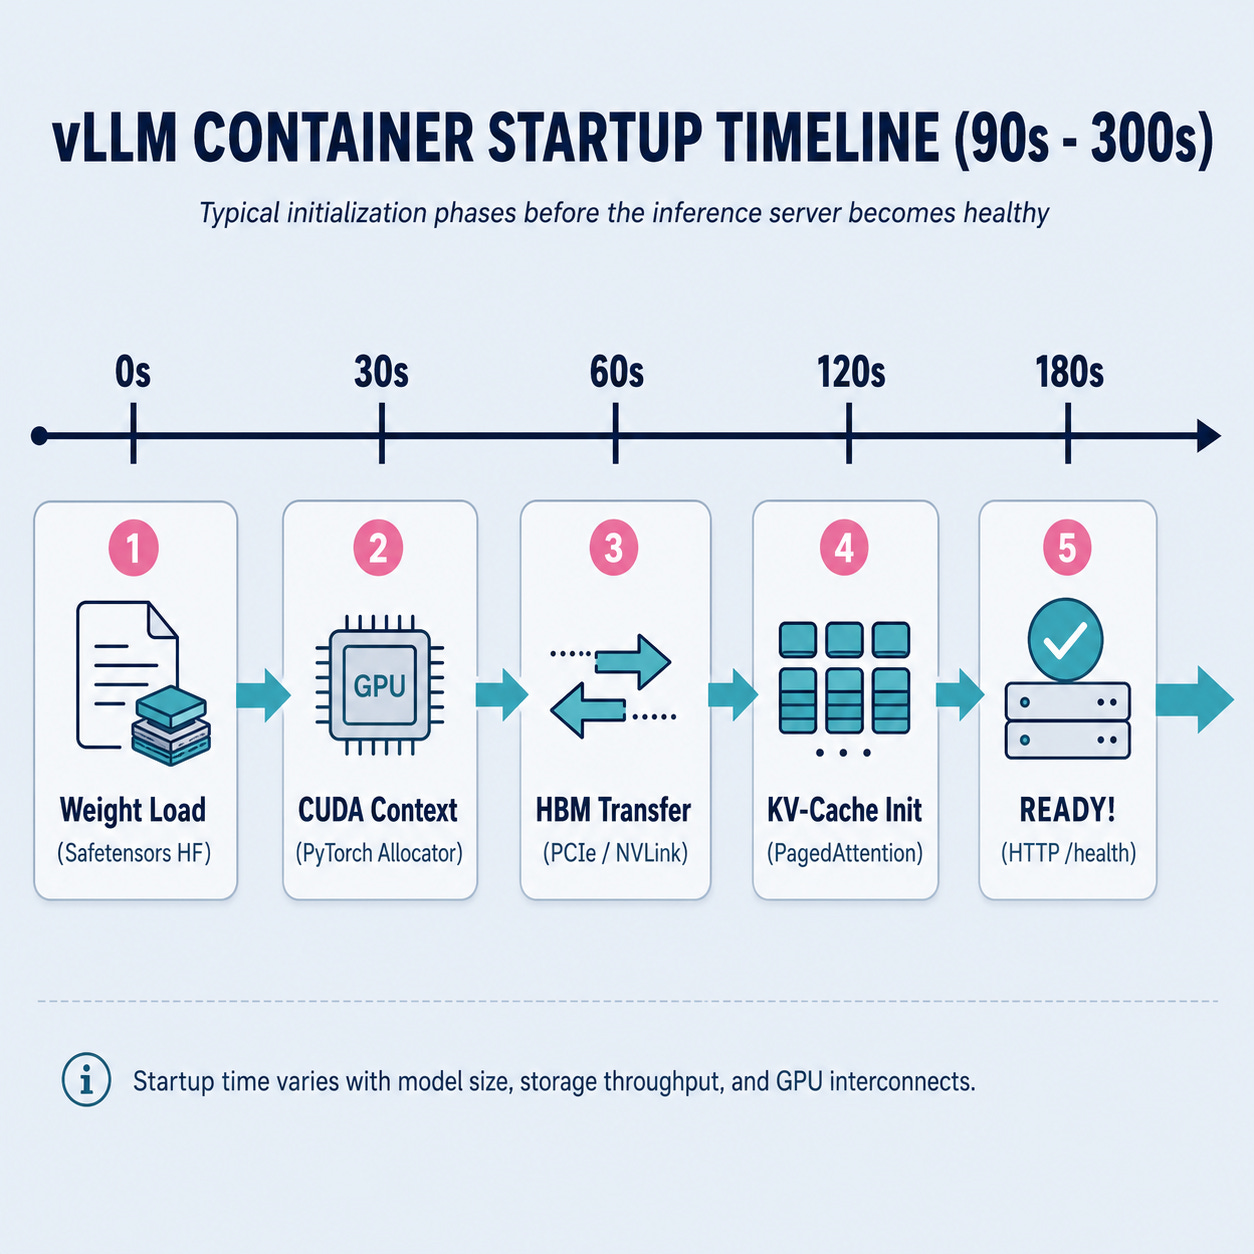
What exactly takes place during those minutes? When we launch a vLLM container within a Kubernetes Pod, it goes through four successive stages before it is able to serve a single token.
The first of these is model weight ingestion, in which 14GB to 30GB of FP16/BF16 Safetensors weights (for example, Qwen2.5-7B-Instruct) are pulled from either the local disk or a persistent volume claim (remember, the PVC) and loaded into the CPU's system memory.
The second stage is CUDA context and driver initialization, during which PyTorch sets up the CUDA driver context, registers hooks for GPU memory management, and pre-allocates the internal CUDA execution handles, thereby using up about 500MB to 1GB of VRAM as overhead.
The third stage involves the host-to-device transfer, where those weights are moved from CPU RAM into GPU VRAM.
Finally, there is the PagedAttention profiling and KV-cache allocation, consisting of vLLM carrying out dummy forward passes to determine the peak VRAM usage and to allocate the PagedAttention KV-cache block table. The dummy forward pass alone can take 30 to 60 seconds.
Now, I have a question for you:
What would happen if you used the same health probe settings that you would with a typical web service?
Short answer …
# ❌ NAÏVE WEB PROBE CONFIGURATION (CAUSES CRASHLOOPBACKOFF!)
readinessProbe:
  httpGet:
    path: /health
    port: 8000
  initialDelaySeconds: 5
  periodSeconds: 10
  failureThreshold: 3 # Fails after 30 seconds total!
Observe what happens when the program is running. At the fifth second, the Kubelet sends an HTTP GET request to http://localhost:8000/health.
However, vLLM is still in Stage 1, which involves downloading the weights into CPU RAM, so it responds with a Connection Refused. The Kubelet then attempts the request again at the fifteenth and twenty-fifth second, and by that time vLLM has reached Stage 3 and is pushing the weights into VRAM, yet it continues to fail to respond.
At the thirty-fifth second, after three consecutive failed attempts, the Kubelet concludes that the container is hung and sends it a SIGKILL. Kubernetes then restarts the container, and the Pod ends up in an infinite CrashLoopBackOff, downloading 20GB of weights and being killed during initialization, repeatedly.
The solution? 👇
DO NOT TREAT THE MODEL SERVER AS IF IT WERE A WEB SERVER!
Kubernetes provides three different kinds of probe, and if these are correctly configured, they ensure that vLLM has sufficient time to initialize its VRAM while preventing any HTTP 503 errors from occurring once traffic begins.
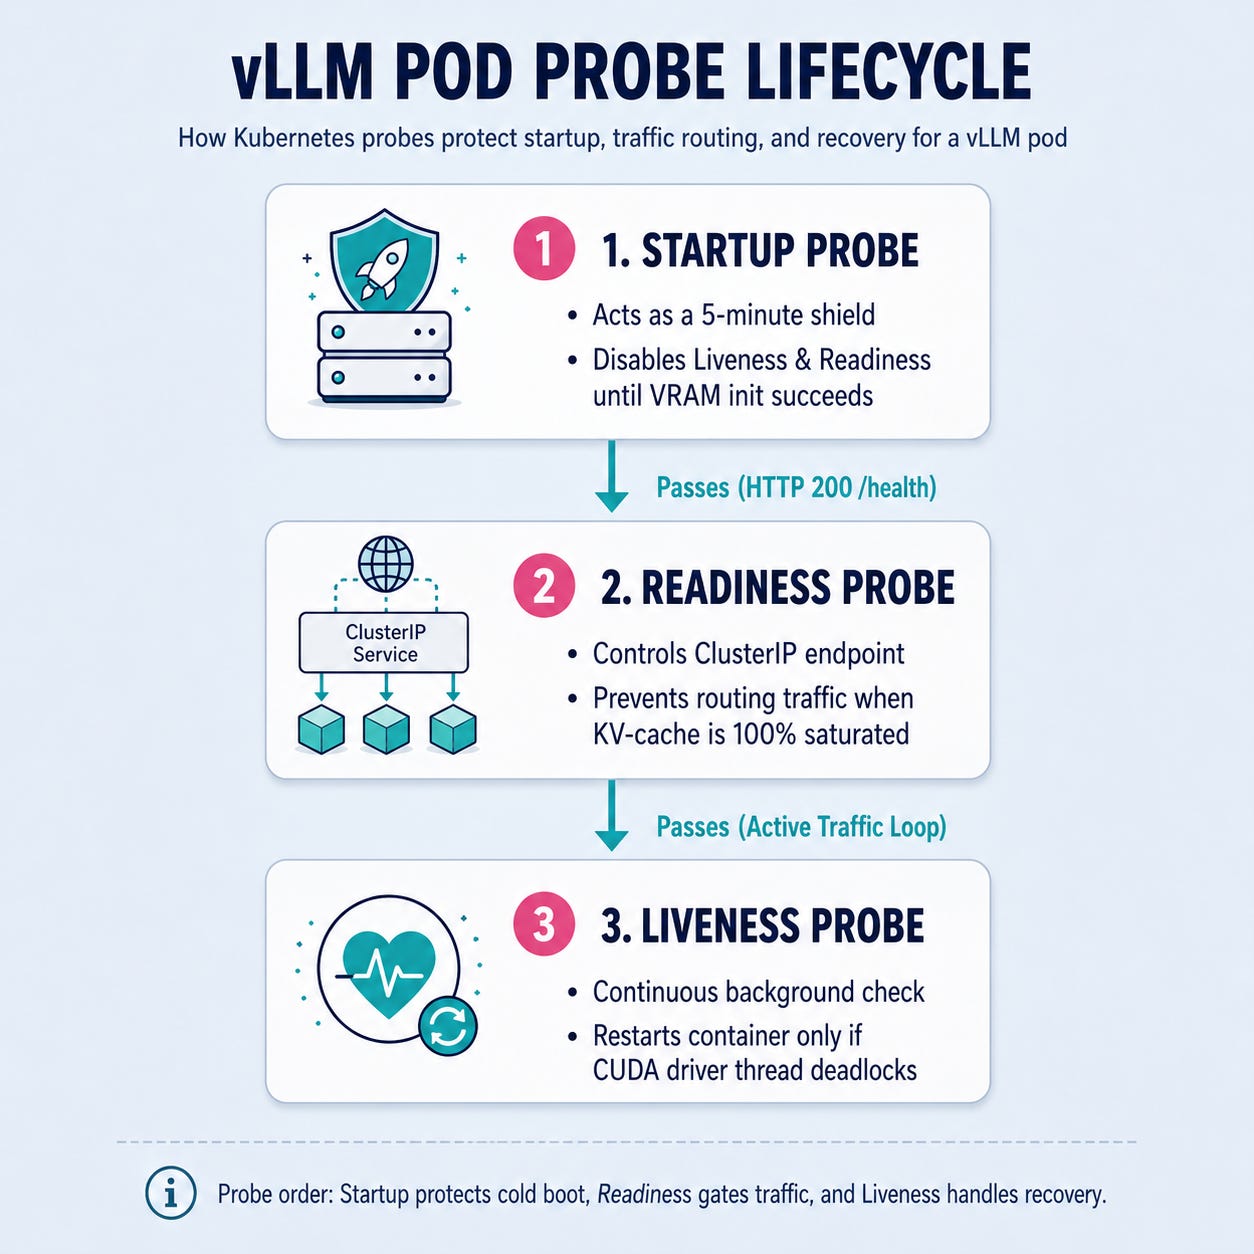
Each probe carries out a single function.
The startupProbe acts as a shield for VRAM initialization. It completely turns off the readiness and liveness checks until the container has finished its heavy-weight loading and KV-cache profiling. The calculation is straightforward: your maximum startup timeframe is equal to periodSeconds multiplied by failureThreshold, so make sure that figure is well above the worst-case initialization time. If you set periodSeconds to 10 and failureThreshold to 30, you're giving vLLM a clear 300 seconds (five minutes) to become ready before Kubernetes considers killing it.
The readinessProbe is responsible for traffic isolation and it's because of this that you get zero 503 errors. It determines whether or not the Pod's IP address should be included in the list of endpoints for the internal ClusterIP Service. When the Pod's KV-cache fills up to 100% during a burst in traffic or when vLLM begins to preempt requests, the readiness probe fails and Kubernetes then quietly removes that Pod's IP from being used until the VRAM is free again, directing incoming users to the other healthy replicas instead.
Finally, the livenessProbe serves as your CUDA deadlock recovery mechanism. It keeps an eye on the running engine throughout the entire period that the service is in operation, and if it detects an unrecoverable CUDA driver thread deadlock or a GPU kernel panic (after three consecutive failures, approximately 45 seconds), Kubernetes will restart the Pod in order to recover the CUDA driver state.
If you put all the elements together, the following is an example of a complete and production-grade vLLM Deployment manifest, including the correct GPU resource requests (nvidia.com/gpu: 1), a POSIX shared memory mount for /dev/shm, and all three probes properly connected:
# vllm-deployment.yaml
apiVersion: apps/v1
kind: Deployment
metadata:
  name: vllm-server-qwen
  labels:
    app: vllm-server
spec:
  replicas: 1
  selector:
    matchLabels:
      app: vllm-server
  template:
    metadata:
      labels:
        app: vllm-server
    spec:
      # Toleration allowing pod to schedule onto tainted GPU node pool
      tolerations:
        - key: "sku"
          operator: "Equal"
          value: "gpu"
          effect: "NoSchedule"
      containers:
        - name: vllm-container
          image: vllm/vllm-openai:v0.6.0
          args:
            - "--model"
            - "Qwen/Qwen2.5-7B-Instruct"
            - "--port"
            - "8000"
            - "--max-model-len"
            - "8192"
            - "--gpu-memory-utilization"
            - "0.90"
          ports:
            - containerPort: 8000
              name: http
          resources:
            requests:
              cpu: "4000m"
              memory: "16Gi"
              nvidia.com/gpu: "1"
            limits:
              cpu: "8000m"
              memory: "32Gi"
              nvidia.com/gpu: "1"

          # =========================================================
          # 1. STARTUP PROBE: Gives 5 Minutes (30 * 10s = 300s) for VRAM Init
          # =========================================================
          startupProbe:
            httpGet:
              path: /health
              port: 8000
            initialDelaySeconds: 20 # Wait 20s before first check
            periodSeconds: 10       # Check every 10s
            failureThreshold: 30    # Allow up to 30 failures (300s total)

          # =========================================================
          # 2. READINESS PROBE: Controls ClusterIP Endpoint Registration
          # =========================================================
          readinessProbe:
            httpGet:
              path: /health
              port: 8000
            periodSeconds: 5
            failureThreshold: 2     # Fails fast to remove Pod from service router

          # =========================================================
          # 3. LIVENESS PROBE: Restarts Pod if CUDA Thread Deadlocks
          # =========================================================
          livenessProbe:
            httpGet:
              path: /health
              port: 8000
            periodSeconds: 15
            failureThreshold: 3     # Restarts container after 45s of unresponsive state

          # Mounting POSIX Shared Memory for CUDA IPC
          volumeMounts:
            - mountPath: /dev/shm
              name: dshm
      volumes:
        - name: dshm
          emptyDir:
            medium: Memory
            sizeLimit: 4Gi
GPU Hardware
Kubernetes was originally built for CPU-bound web applications, which means that integrating GPUs introduces low-level hardware constraints that, as AI / ML Engineers, we need to understand.
Nuance 1: GPUs are only available in whole numbers.
Normally Kubernetes allows you to allocate resources very finely. For example, you can request half of a CPU core (cpu: 500m) or a specific amount of RAM (memory: 512Mi). With GPUs, however, the situation is different. By default, the NVIDIA Device Plugin only permits you to request full GPUs:
resources:
  limits:
    nvidia.com/gpu: 1 # You MUST request integer GPUs (1, 2, 4, 8)
If you attempt to request nvidia.com/gpu: 0.5, the Kubernetes API server will simply reject your manifest; there is no built-in method for requesting 'half a GPU'.
Nevertheless, there are a few genuine methods of sharing a single physical GPU among different workloads, each with its own set of drawbacks. Time-slicing allows multiple Pods to take turns using the same GPU by multiplexing their CUDA contexts. It's useful for development and staging environments, but it provides no VRAM isolation, meaning that one greedy process can cause the others to be starved of resources. Multi-Instance GPU (MIG), which is available on A100 and H100 cards, carries out proper hardware-level partitioning by dividing one GPU into up to 7 completely isolated slices, each with its own dedicated VRAM and computing power (you would request something such as nvidia.com/mig-3g.40gb). MPS (Multi-Process Service) enables several CUDA applications to submit work to a single GPU at the same time, overlapping their compute kernels so as to get more performance from the hardware.
Nuance 2: Kubernetes does not have the ability to detect your VRAM
Here's what's most important to understand: the Kubernetes scheduler has no knowledge of how much GPU VRAM your workload requires.
If you request nvidia.com/gpu: 1, Kubernetes all that does is check whether there is a physical GPU slot available on one of the nodes. It has no knowledge of how much VRAM your model will use (either 2GB or 40GB) and there are many other things competing for that VRAM.
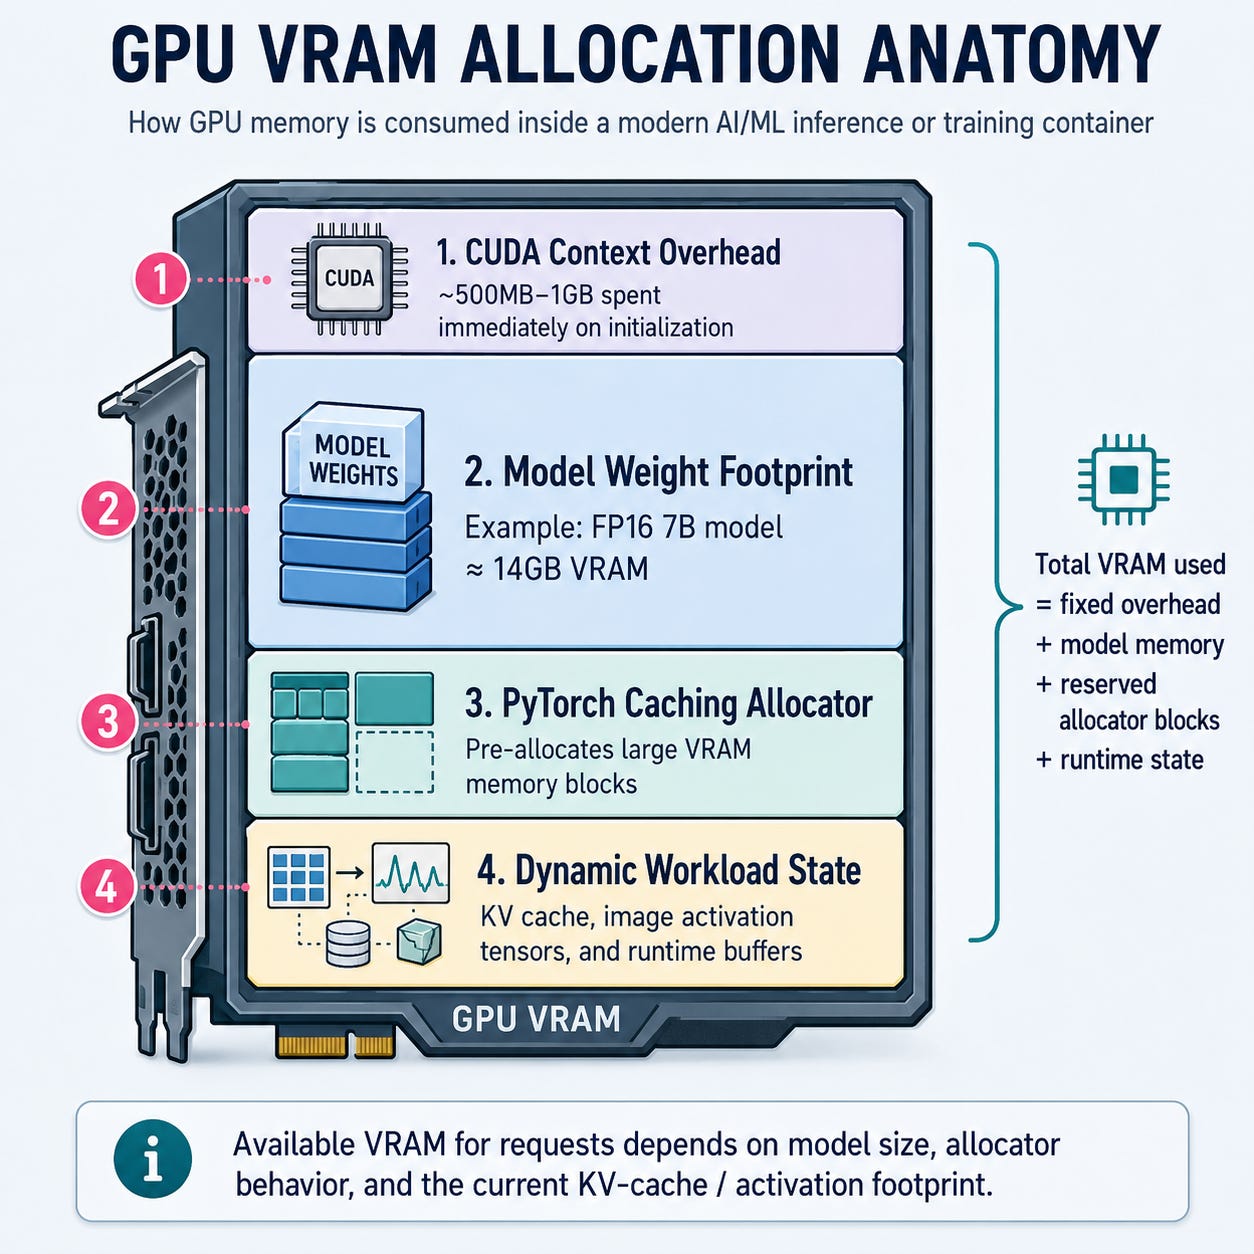
It becomes more complicated since PyTorch's caching allocator obtains large chunks of VRAM directly from the driver and keeps them for itself rather than returning them to the operating system. This is the reason why standard Kubernetes memory monitoring displays constant, unchanged usage (because it is unable to observe what is actually happening inside the GPU).
And if two independent processes both attempt to exceed the physical VRAM limit, a catastrophic CUDA out-of-memory error occurs, or even worse, the NVIDIA driver causes a complete host kernel panic.
Nuance 3: The trap involving 64MB of shared memory
In situations involving computer vision, when scanning high-resolution documents or processing video frames, the pre-processing workers pass the raw image tensors to the deep learning workers via a POSIX shared memory area known as /dev/shm. The issue here is that Docker and Kubernetes normally limit /dev/shm to just 64 megabytes.
PyTorch DataLoader Batching ──► Passes Tensors via /dev/shm ──► EXCEEDS 64MB ──► Bus Error (SIGBUS) 💥At that point, when your PyTorch DataLoader starts up worker subprocesses (with num_workers greater than 0) in order to batch the images, it exceeds the 64MB limit and the container crashes with a mysterious Bus error (core dumped), with no clear explanation whatsoever, merely a crash.
Once you know the solution, it's simple:
Attach a RAM-backed emptyDir volume to /dev/shm so that it has proper space to work with.
spec:
  containers:
    - name: vision-encoder-worker
      image: tnm/vision-worker:v1
      volumeMounts:
        - mountPath: /dev/shm
          name: dshm
  volumes:
    - name: dshm
      emptyDir:
        medium: Memory
        sizeLimit: 4Gi # Allocates 4GB of host RAM for zero-copy POSIX shared memory
Nuance 4: The actual location of your GPUs matters
The token throughput in the case of multi-GPU pods using tensor parallelism (for example, when using 4 A100s or 8 H100s working together) depends directly on the speed of communication between the GPUs, and these speeds differ greatly according to how the GPUs are connected.
NVLink, used for connecting the GPUs within the same physical node, provides a bidirectional bandwidth of up to 900 GB/s per GPU. The PCIe host bus is much slower, ranging from 32 to 64 GB/s, and this becomes a serious bottleneck when the GPUs are syncing the weights. Moreover, to connect GPUs that are on different nodes (using RoCE or InfiniBand) you need specialized Kubernetes CNI plugins such as SR-IOV in order to bypass the overhead associated with normal TCP networking.
The key point is this: if you're setting up multi-GPU node pools, you should ensure that Pods requesting multiple GPUs are actually placed on a single physical host that is connected via NVLink, rather than being distributed among separate VMs that communicate through the slow PCIe link. The performance will be very different depending on where these Pods end up.
Workload Archetypes
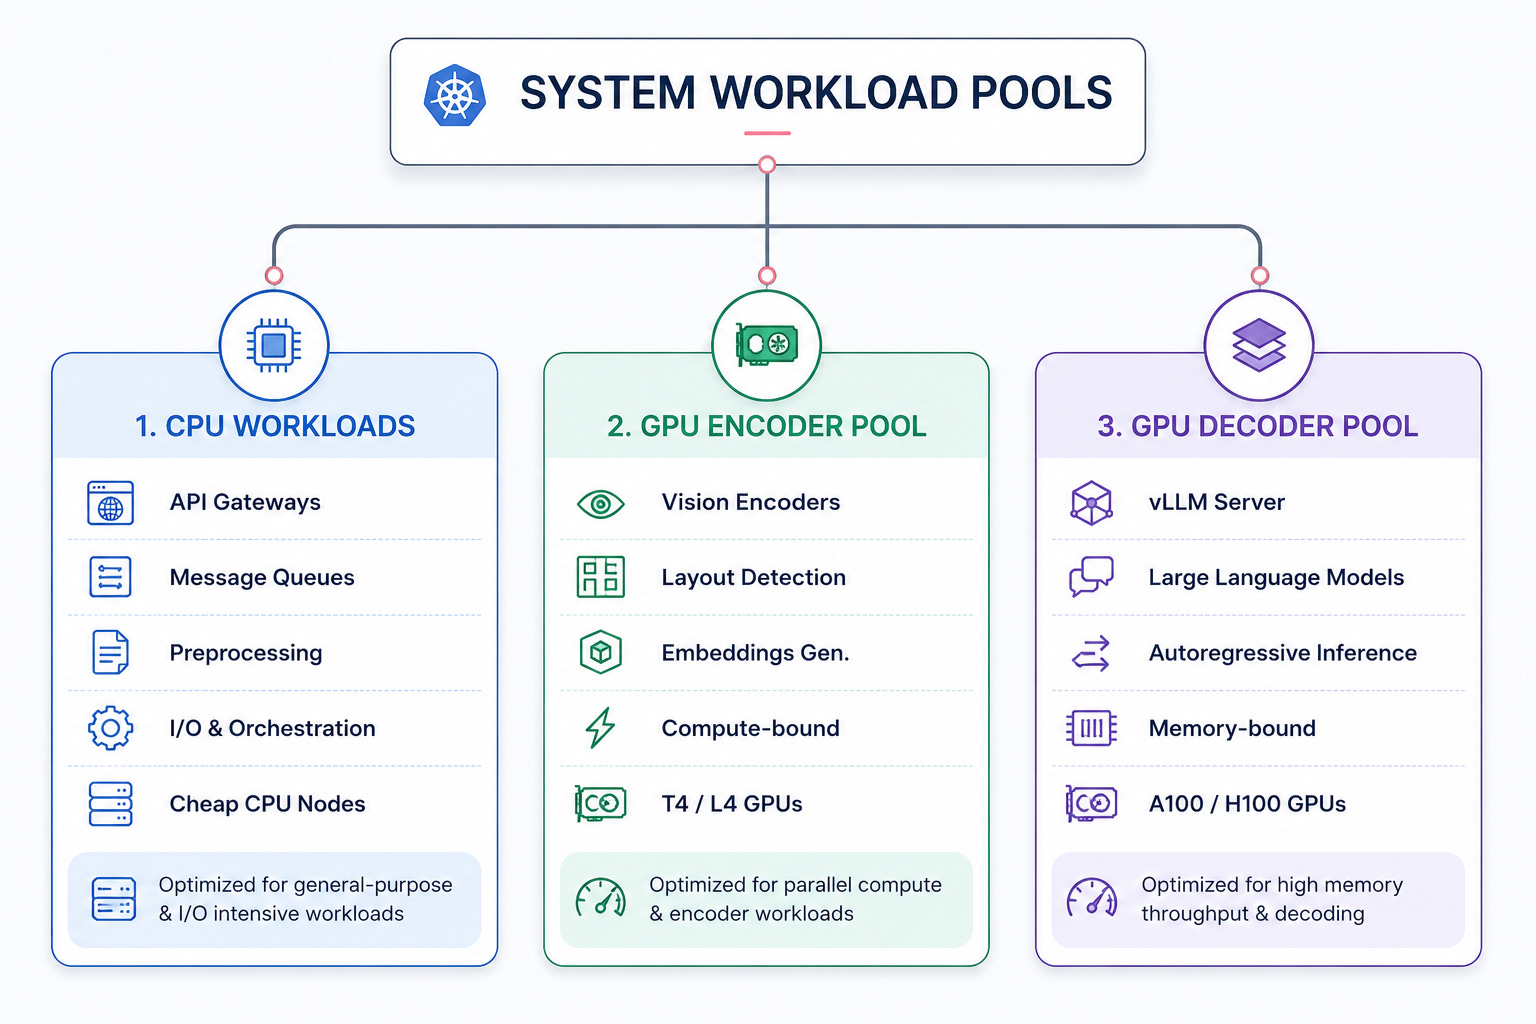
It is useful to consider three clear types of AI workloads out there, each with its own requirements in terms of hardware, cost structure, and behaviour. Let's explore them:
Archetype 1: CPU workloads
This includes all the application logic that does not involve heavy inference.
Examples are routing API requests, managing authentication, operating the queue producers and consumers (using Redis or RabbitMQ), resizing images, extracting text from PDFs, and running the vector database indexing sidecars. The work involved is highly concurrent and I/O bound, consisting of multi-threaded CPU processing that spends most of its time waiting for the network or the disk rather than performing calculations. It can run smoothly on standard and cost-effective CPU node pools (for example, Standard_D2s_v3 or Standard_D4s_v5) and is inexpensive, at a cost of about $0.03 to $0.15 per node-hour.
Archetype 2: GPU encoder workloads
They include your vision encoders (such as ViT and ResNet), the layout detection models, the OCR text recognition modules, and the dense embedding generators like Jina or BGE. The characteristic feature is a single forward pass, that is, parallel matrix multiplication with fixed output dimensions, taking inputs and producing outputs.
Most importantly, these models are entirely stateless, so no information is carried from one request to the next. Since the bottleneck is computational power, their performance is limited by the number of Tensor Cores and the total number of FLOPs rather than by memory bandwidth. For this reason they work well on inexpensive single-GPU instances (for example, the NVIDIA T4, L4, or A10G), placing them in the moderate cost bracket at about $0.15 to $0.70 per GPU-hour.
Archetype 3: GPU generative decoder workloads
Here's the heavy-duty end of the story: generative and multimodal large language models, along with vLLM inference engines, include examples such as Qwen-VL, Llama 3, and DeepSeek.
Rather than processing in a single go, they operate using an autoregressive loop, producing one token at a time. The bottleneck changes during the course of a request: the prefill stage is compute-intensive (in terms of FLOPs), whereas during the decode phase it becomes bandwidth-limited, constrained by the speed at which data can be transferred through High-Bandwidth Memory. Unlike the encoders, these models are highly stateful since the Key-Value (KV) cache increases with each turn in the conversation. Because of all this, high-end HBM3 multi-GPU instances (such as the A100, H100, and H200) are required, which is also the reason they form the more expensive tier, costing between $2.00 and $10.00 per GPU-hour.
Here's how the three stack up side by side:
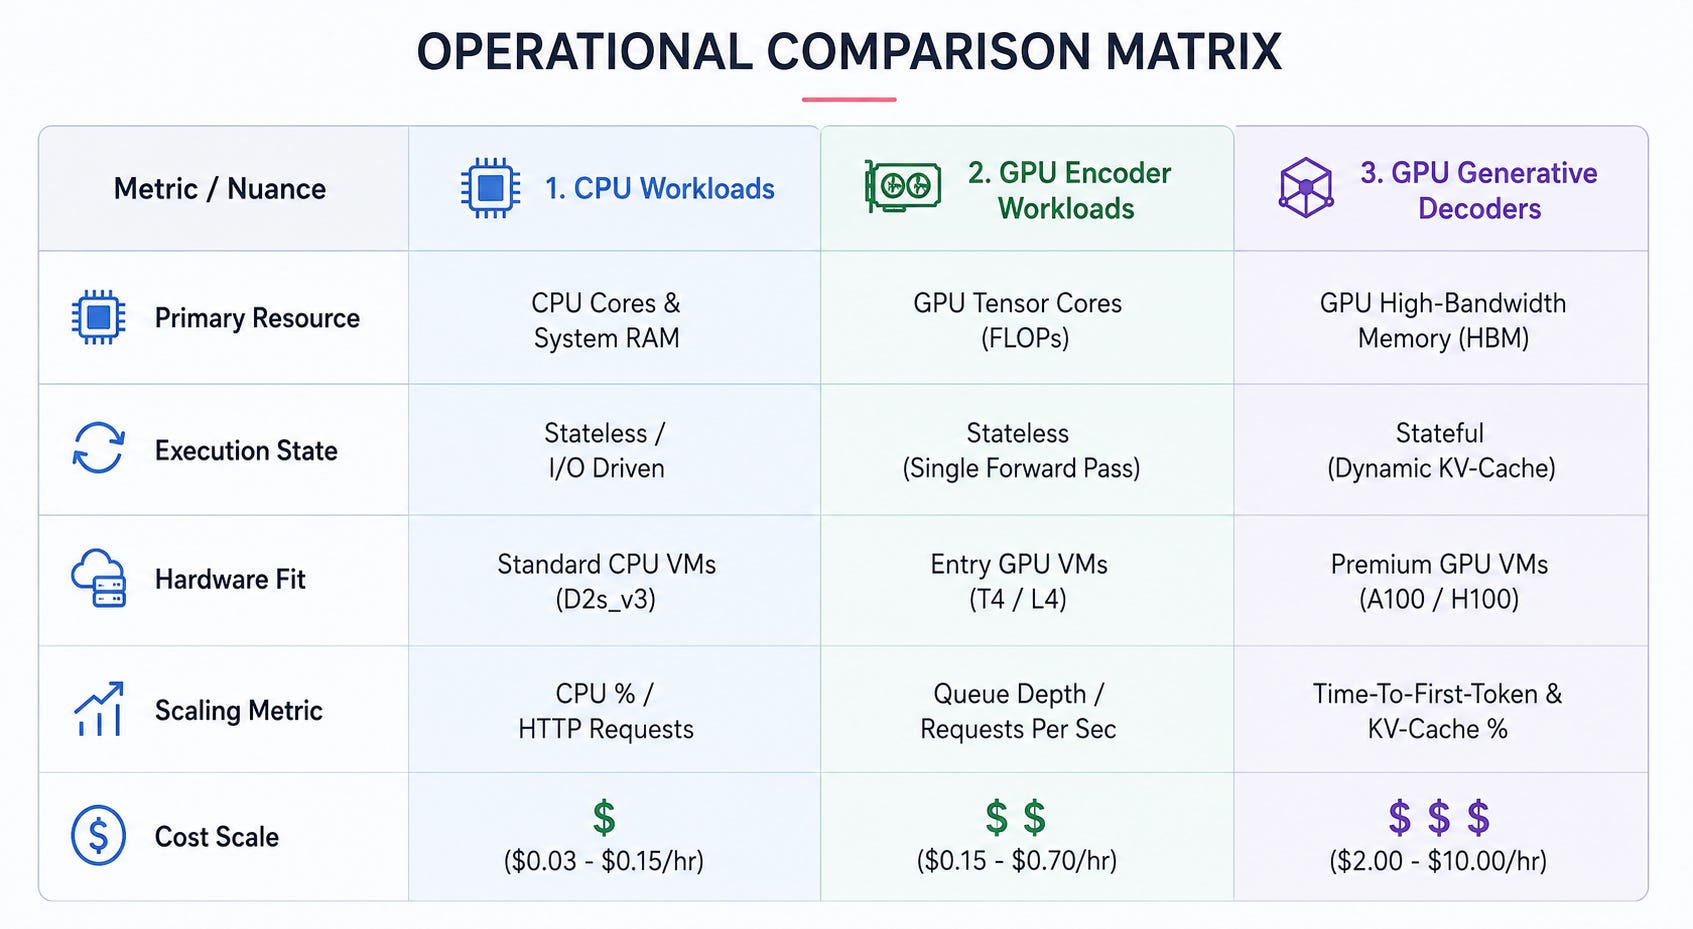
Before we move to the next section, here's the golden rule of AI infra:
🏆 NEVER colocate CPU tasks, GPU Encoders, and GPU Decoders on the same node pool! Running lightweight CPU preprocessing on expensive A100 nodes burns money pointlessly, while running vLLM on T4 GPUs causes severe KV-cache thrashing and unacceptable latency spikes.
Kubernetes Scheduling Rules
We have discussed the three workloads, but how are you actually meant to put into effect this hardware separation? I mean, how to actually ensure that CPU workloads and encoders and decoders each remain on their own node pools?
Well, Kubernetes provides three scheduling tools for this: taints, tolerations, and node affinity.
Although these are fundamental they are also some of the most misunderstood concepts in the whole field of cloud-native engineering, so let's first clear up the confusion.
❌ Misconception 1: "Adding a Toleration to my Pod forces it to run on the GPU node."
The initial error is to assume that a toleration causes a Pod to be placed on a GPU node. A toleration is not like a magnet or a one-way arrow; it's merely a kind of permission allowing a Pod to enter a node that has restrictions.
Suppose you add the toleration [{ key: “sku”, value: “a100”, effect: “NoSchedule” }] to a vLLM Pod but don't specify a nodeSelector or nodeAffinity. Kubernetes is then entirely at liberty to put that vLLM Pod on a cheap CPU node. The only thing the toleration states is: "If by chance you place me on an A100 node, I won't object." It never says "put me there."
❌ Misconception 2: “Setting nodeSelector is enough to protect my GPU nodes.”
The second error is to think that a nodeSelector alone is sufficient for protecting your GPU nodes. While a nodeSelector tells your Pod where to be placed, it provides no mechanism for keeping other Pods away from those nodes. For example, if you set up an A100 pool with the label agentpool: a100pool but fail to taint the nodes, then any UNCONSTRAINED NGINX pod, Prometheus scraper, or web API will be able to schedule itself onto your $10/hr A100 and use up its CPU and RAM.
❌ Misconception 3: “Taints lock a node pool so only one Pod can run.”
The third error is to think that a Taint restricts a node so that only one Pod can be assigned to it. In fact, nothing of the sort is locked in place for a single Pod. A taint merely repels Pods that do not have the corresponding toleration. As many Pods as have the appropriate toleration can then be assigned to that node until the node’s CPU, RAM, or nvidia.com/gpu slots are exhausted.
The formula for real GPU isolation
When the misunderstandings have been removed, it is clear that all three tools must work in unison. None of them alone is enough.

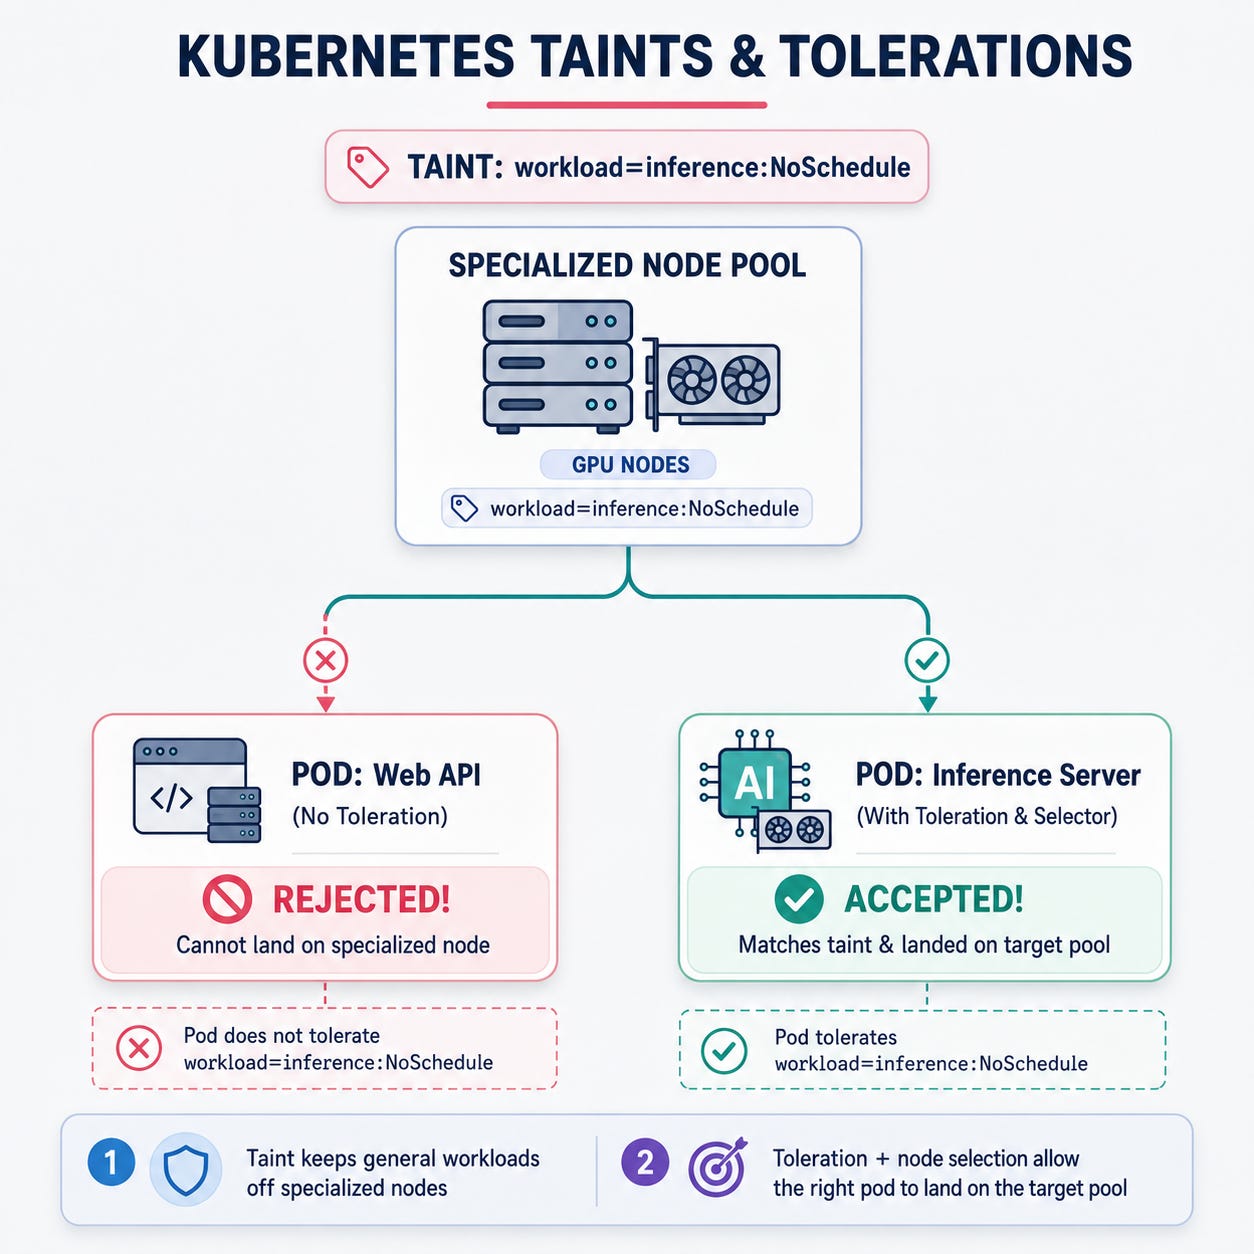
In practice, you taint and label the node pool when you create it, then give the Pod both a matching toleration and a matching selector:
# 1. NODE POOL CONFIGURATION (Azure CLI)
az aks nodepool add \
  --resource-group tnm-rg \
  --cluster-name tnm-cluster \
  --name a100pool \
  --node-count 1 \
  --node-vm-size Standard_NC24ads_A100_v4 \
  --node-taints sku=a100:NoSchedule \
  --labels accelerator=nvidia-a100

# 2. POD MANIFEST CONFIGURATION (vLLM Deployment)
spec:
  # A. TOLERATION: Passport allowing Pod to cross the A100 taint barrier
  tolerations:
    - key: "sku"
      operator: "Equal"
      value: "a100"
      effect: "NoSchedule"

  # B. NODE SELECTOR: Forces Pod to land ONLY on nodes labeled accelerator=nvidia-a100
  nodeSelector:
    accelerator: nvidia-a100
Now, not all taints behave the same.
One other point that's important to grasp is that taints have three different "effects", and this difference is significant.
NoSchedule provides strong protection for new Pods; it prevents any Pod without the appropriate toleration from being scheduled onto the node, but if Pods were already running before the taint was applied, it leaves them untouched.
PreferNoSchedule is a milder and advisory option; it requests that the scheduler avoid scheduling non-matching Pods onto the node, but will allow them to be placed there if all the other nodes in the cluster are full.
⚠️ Do not use this one on $10/hr GPU nodes, since it’s precisely when the cluster is full that you do not want a random pod taking up space on your A100.
NoExecute is the more aggressive of the three: it stops new Pods that don’t have the matching toleration from being scheduled and immediately evicts any Pods that are already running and lack the appropriate toleration. This eviction feature is what makes NoExecute the suitable choice for situations such as GPU driver upgrades, draining a node for maintenance, or responding when a preemptible Spot GPU node receives a termination notice.
Sometimes a plain key-value nodeSelector can't capture what you need, and that's where Node Affinity comes in, giving you richer boolean matching (In, NotIn, Exists, DoesNotExist). It comes in two flavors.
Hard affinity (
requiredDuringSchedulingIgnoredDuringExecution) is a strict requirement since the Pod must be placed on a node that matches your specifications, and if no such node is available, it will remain in the Pending state rather than proceeding. This is useful in the case where your model actually only runs on particular silicon:affinity: nodeAffinity: requiredDuringSchedulingIgnoredDuringExecution: nodeSelectorTerms: - matchExpressions: - key: nvidia.com/gpu.product operator: In values: - NVIDIA-A100-SXM4-80GB - NVIDIA-H100-80GB-HBM3Soft affinity (
preferredDuringSchedulingIgnoredDuringExecution) is a preference rather than a rule; it attempts to place the Pod on nodes that match your weighted preference but smoothly resorts to other nodes if the preferred ones are full, which is useful in cases such as "prefer this availability zone, but don't fail if it's busy".affinity: nodeAffinity: preferredDuringSchedulingIgnoredDuringExecution: - weight: 100 preference: matchExpressions: - key: topology.kubernetes.io/zone operator: In values: - eastus-1
AI Autoscaling
It is with autoscaling that many AI deployments fail silently, since the default autoscaling tool available in Kubernetes was not designed for use with GPUs.
The standard Horizontal Pod Autoscaler (HPA) increases the number of Pods according to the average amount of CPU or system RAM, on the basis of a rule such as "add more pods when the CPU usage goes above 80 percent". Although this kind of logic works well for web services, it fails when it comes to AI workloads in two major respects.
The initial issue is a high rate of false positives when it comes to GPU utilisation. When an encoder Pod is processing one image, the GPU utilisation jumps straight to 100% during the forward pass, which is exactly what happens in a matrix multiplication. The Horizontal Pod Autoscaler then sees this 100% utilisation and gets alarmed, interpreting it as ‘we’ve run out of capacity’ and therefore creates additional pods that you actually don’t need.
The second issue is even more serious: HPA has no way of knowing about the backlog in your queue. Suppose that 1,000 documents suddenly appear in the ingestion queue and your single GPU worker is working at 100% utilization processing them, yet HPA has no knowledge of the other 999 documents still waiting in Redis or RabbitMQ. In HPA's view, the system appears to be at full capacity and stable, so it takes no action even though the backlog keeps growing.
The solution? Stop scaling according to GPU usage and instead scale based on the actual amount of pending work!
This is exactly what KEDA (Kubernetes Event-driven Autoscaling) does: rather than monitoring CPU or GPU usage, it monitors external event sources such as the length of the Redis queue, the lag of the Kafka consumer, or AWS SQS, and scales your worker pods in accordance with the amount of work that is genuinely waiting.
apiVersion: keda.sh/v1alpha1
kind: ScaledObject
metadata:
  name: encoder-worker-autoscaler
spec:
  scaleTargetRef:
    name: encoder-worker-deployment
  minReplicaCount: 0 # SCALE-TO-ZERO!
  maxReplicaCount: 10
  triggers:
    - type: redis
      metadata:
        listName: ai_task_queue
        listLength: "5" # Scale 1 worker pod for every 5 waiting items
The configuration shared above indicates that one worker pod should be maintained for every five items in the queue, with scaling up to a maximum of ten pods when things get busy. The real advantage, however, is the setting of minReplicaCount to zero, which enables scale-to-zero. Once the queue is empty, KEDA will reduce your worker pods right down to zero. Together with the AKS Cluster Autoscaler, Kubernetes will even deprovision the underlying VM nodes, eliminating 100% of your idle GPU computing costs.
As long as there is no queue, there are no pods and therefore no bill! 💸
Hands-on Lab!
To ensure everyone can execute this hands-on lab without requiring Azure GPU quota approvals, we implement this validation environment using low-cost CPU instances (Standard_D2s_v3) while preserving the exact production taint-toleration topology and inter-pod networking architecture.
