


Today’s spotlight: Anas Riad, breaking down how to deploy ML systems like a pro. Clean insights, zero fluff. Let’s go!
You’re likely used to working in notebooks for your machine learning projects, but you might be wondering how to turn those experiments into something real and valuable in today’s market.
Sure, it’s fun to follow quick tutorials and complete a project a day—but true skill comes from building ML models that are actually deployed and used by real people.
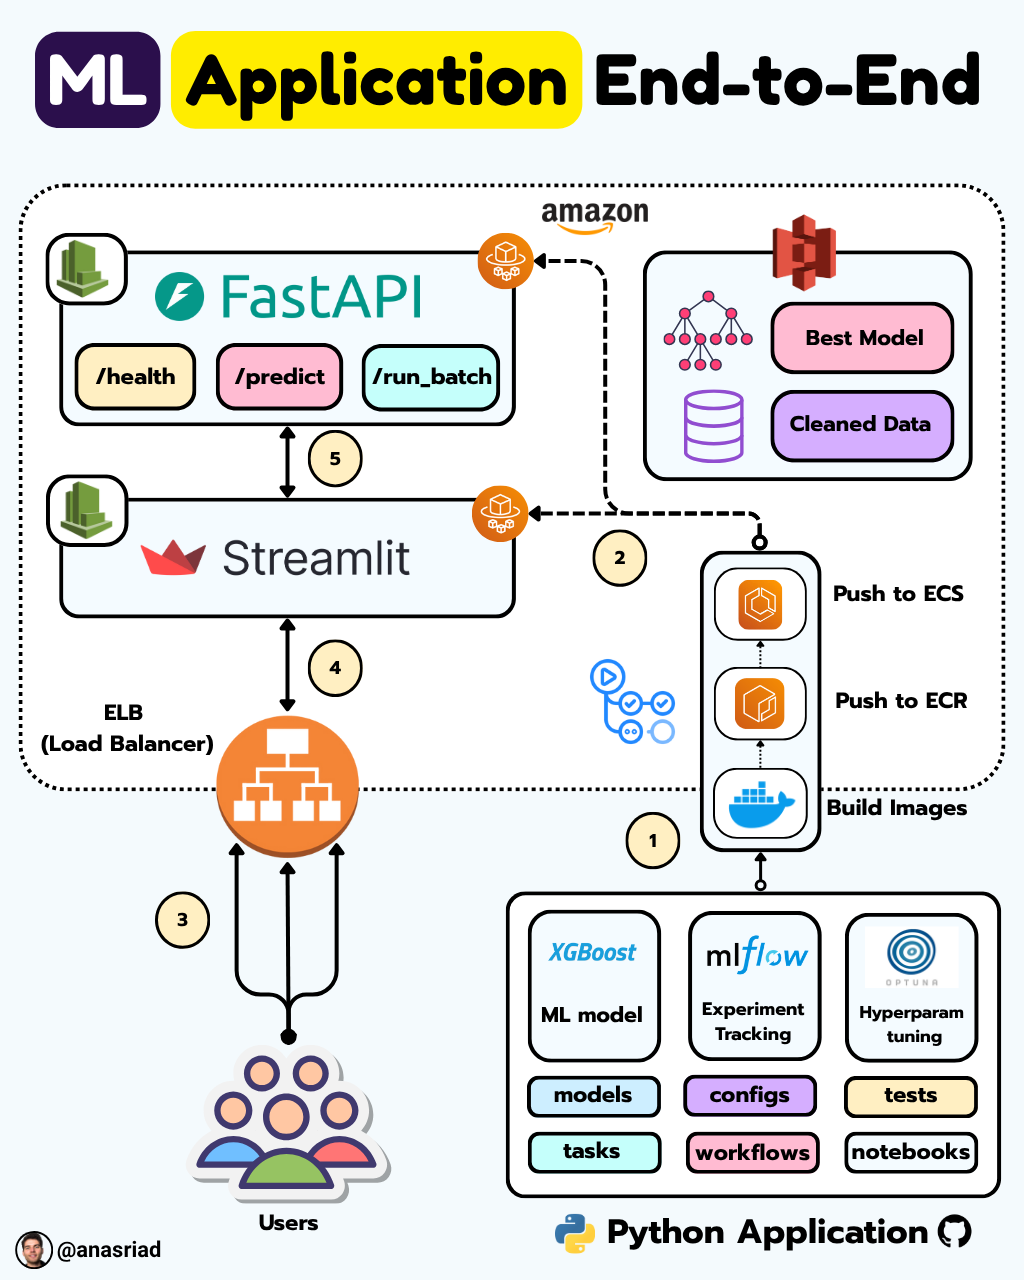
In this article, I’ll guide you through building a Regression model using a powerful stack of modern tools and libraries.
We’ll ensure data quality with Great Expectations, containerize the project using Docker for full reproducibility, and expose the model via an HTTP endpoint using FastAPI. We’ll also leverage MLflow to track experiments, Optuna to fine-tune hyperparameters, and finally deploy the model to AWS using services such as S3, IAM, VPC, ECS Fargate, ECR, and ALB.
There’s a lot to cover, so sit tight and enjoy!
🔗 Follow along with the code in the GitHub repo
If you prefer the video tutorial (2h30!), here’s the link:
Prerequisites
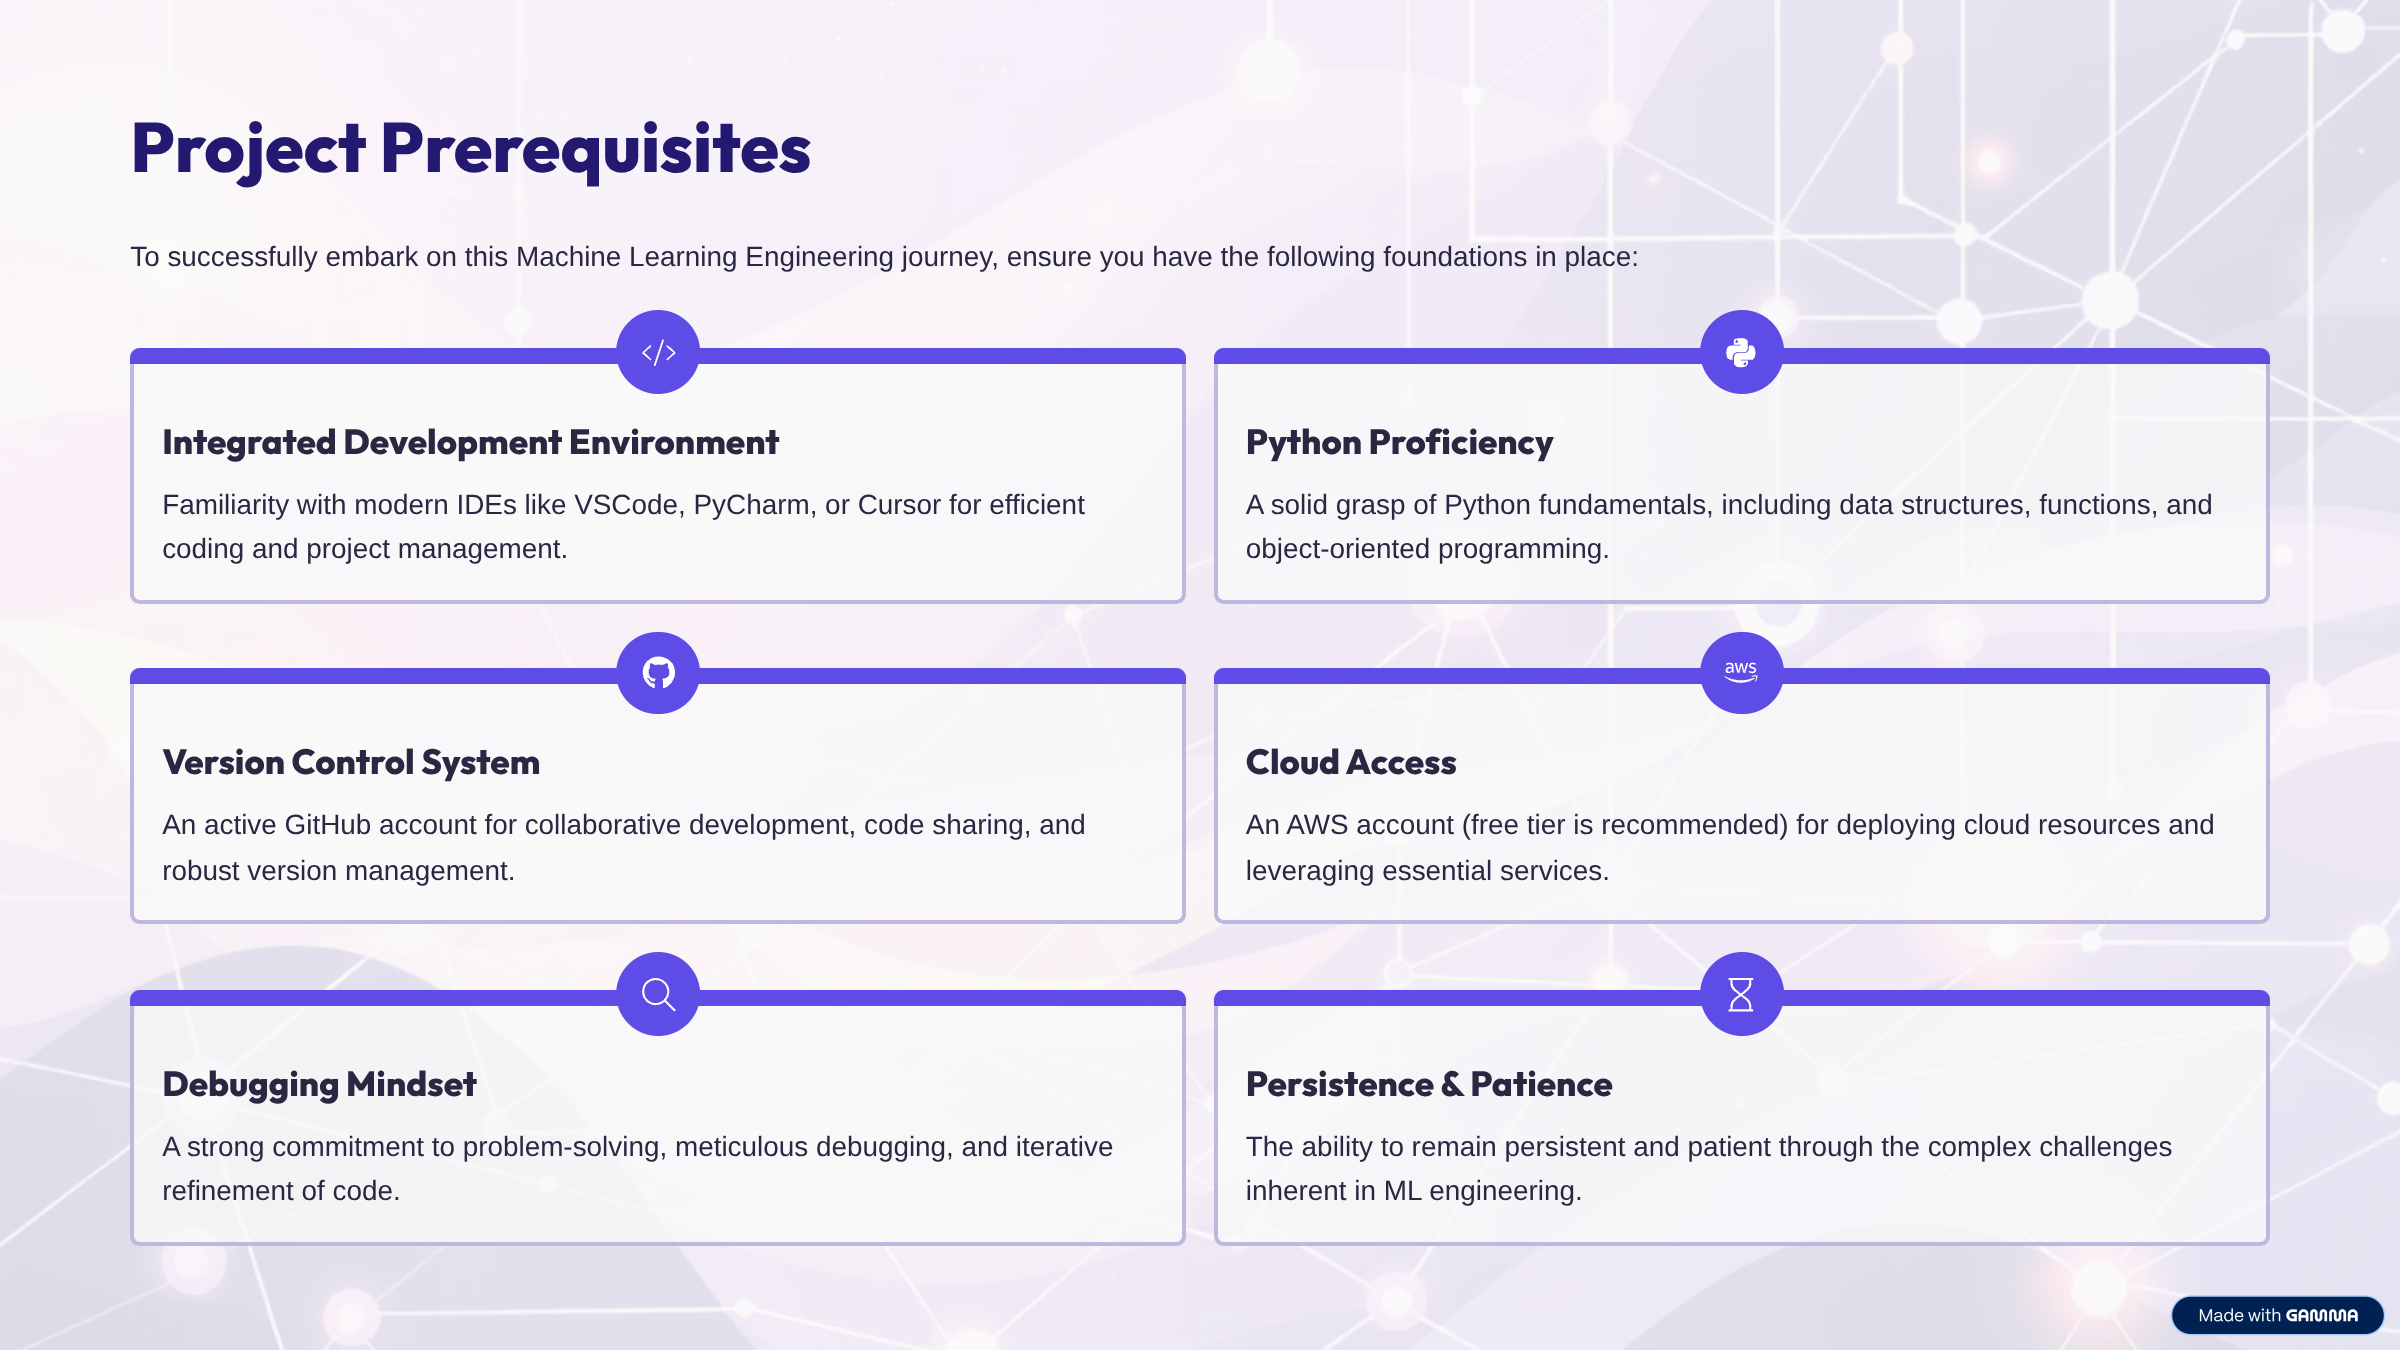
This is not a beginner-level project, which means you’ll need some knowledge of Python programming and machine learning to be able to grasp the content fully. Some prerequisites are stated in the visual below.
Dataset & Scope
US housing dataset with geographic, demographic, and economic features spanning multiple years of market data.
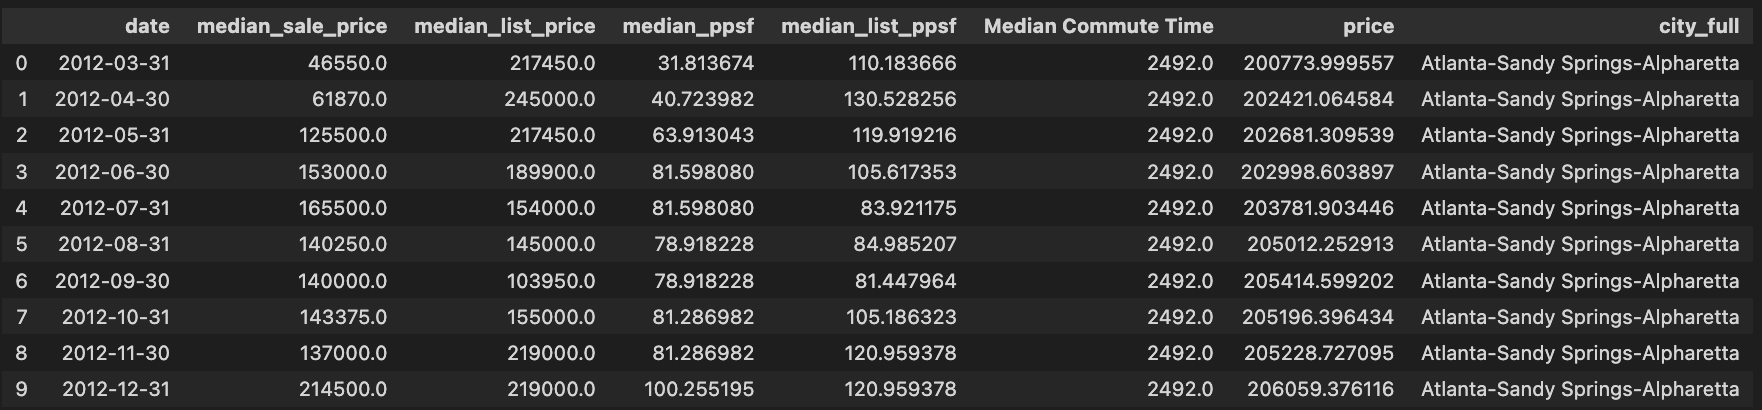
Key columns:
Date: Time Series
Price: The target feature
Other features are independent (will help us make predictions on the target)
Project Goal
Build a production-ready system with automated pipelines, monitoring, and scalable cloud infrastructure to predict housing prices in the US.
Initial Setup
Go to your IDE, for example, VSCode
Open the terminal, then clone the repository
Set the Python environment and install the libraries with uv
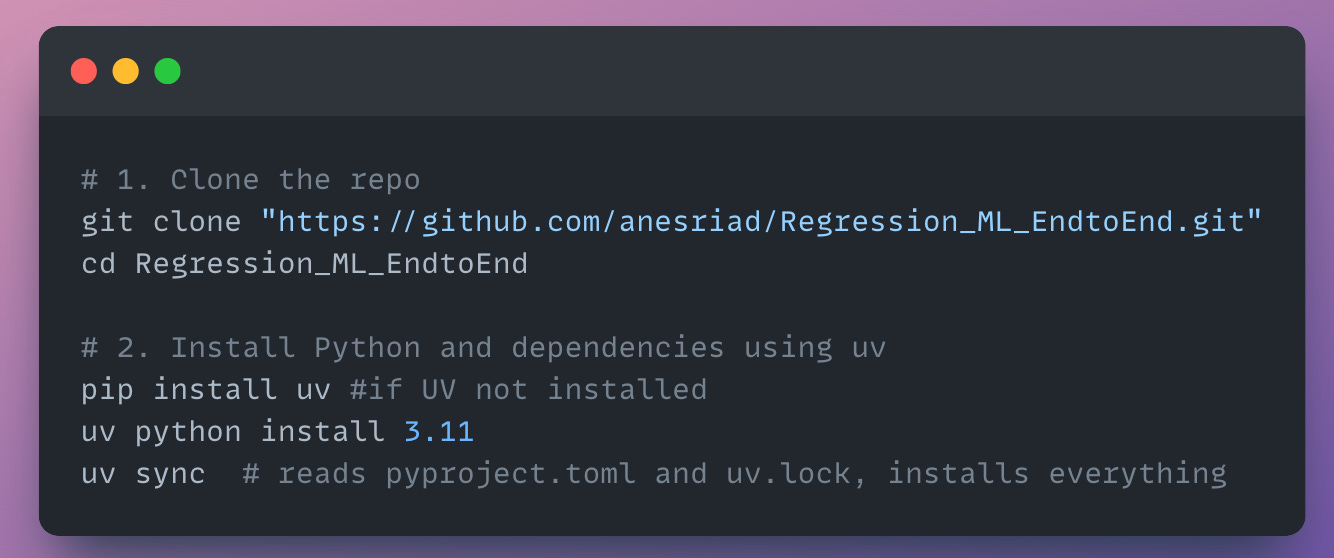
PS: If you want to modify and keep your version, you should fork the repo on GitHub first (creates a personal copy), then clone that fork. Otherwise, if you’re exploring, then cloning is just fine.
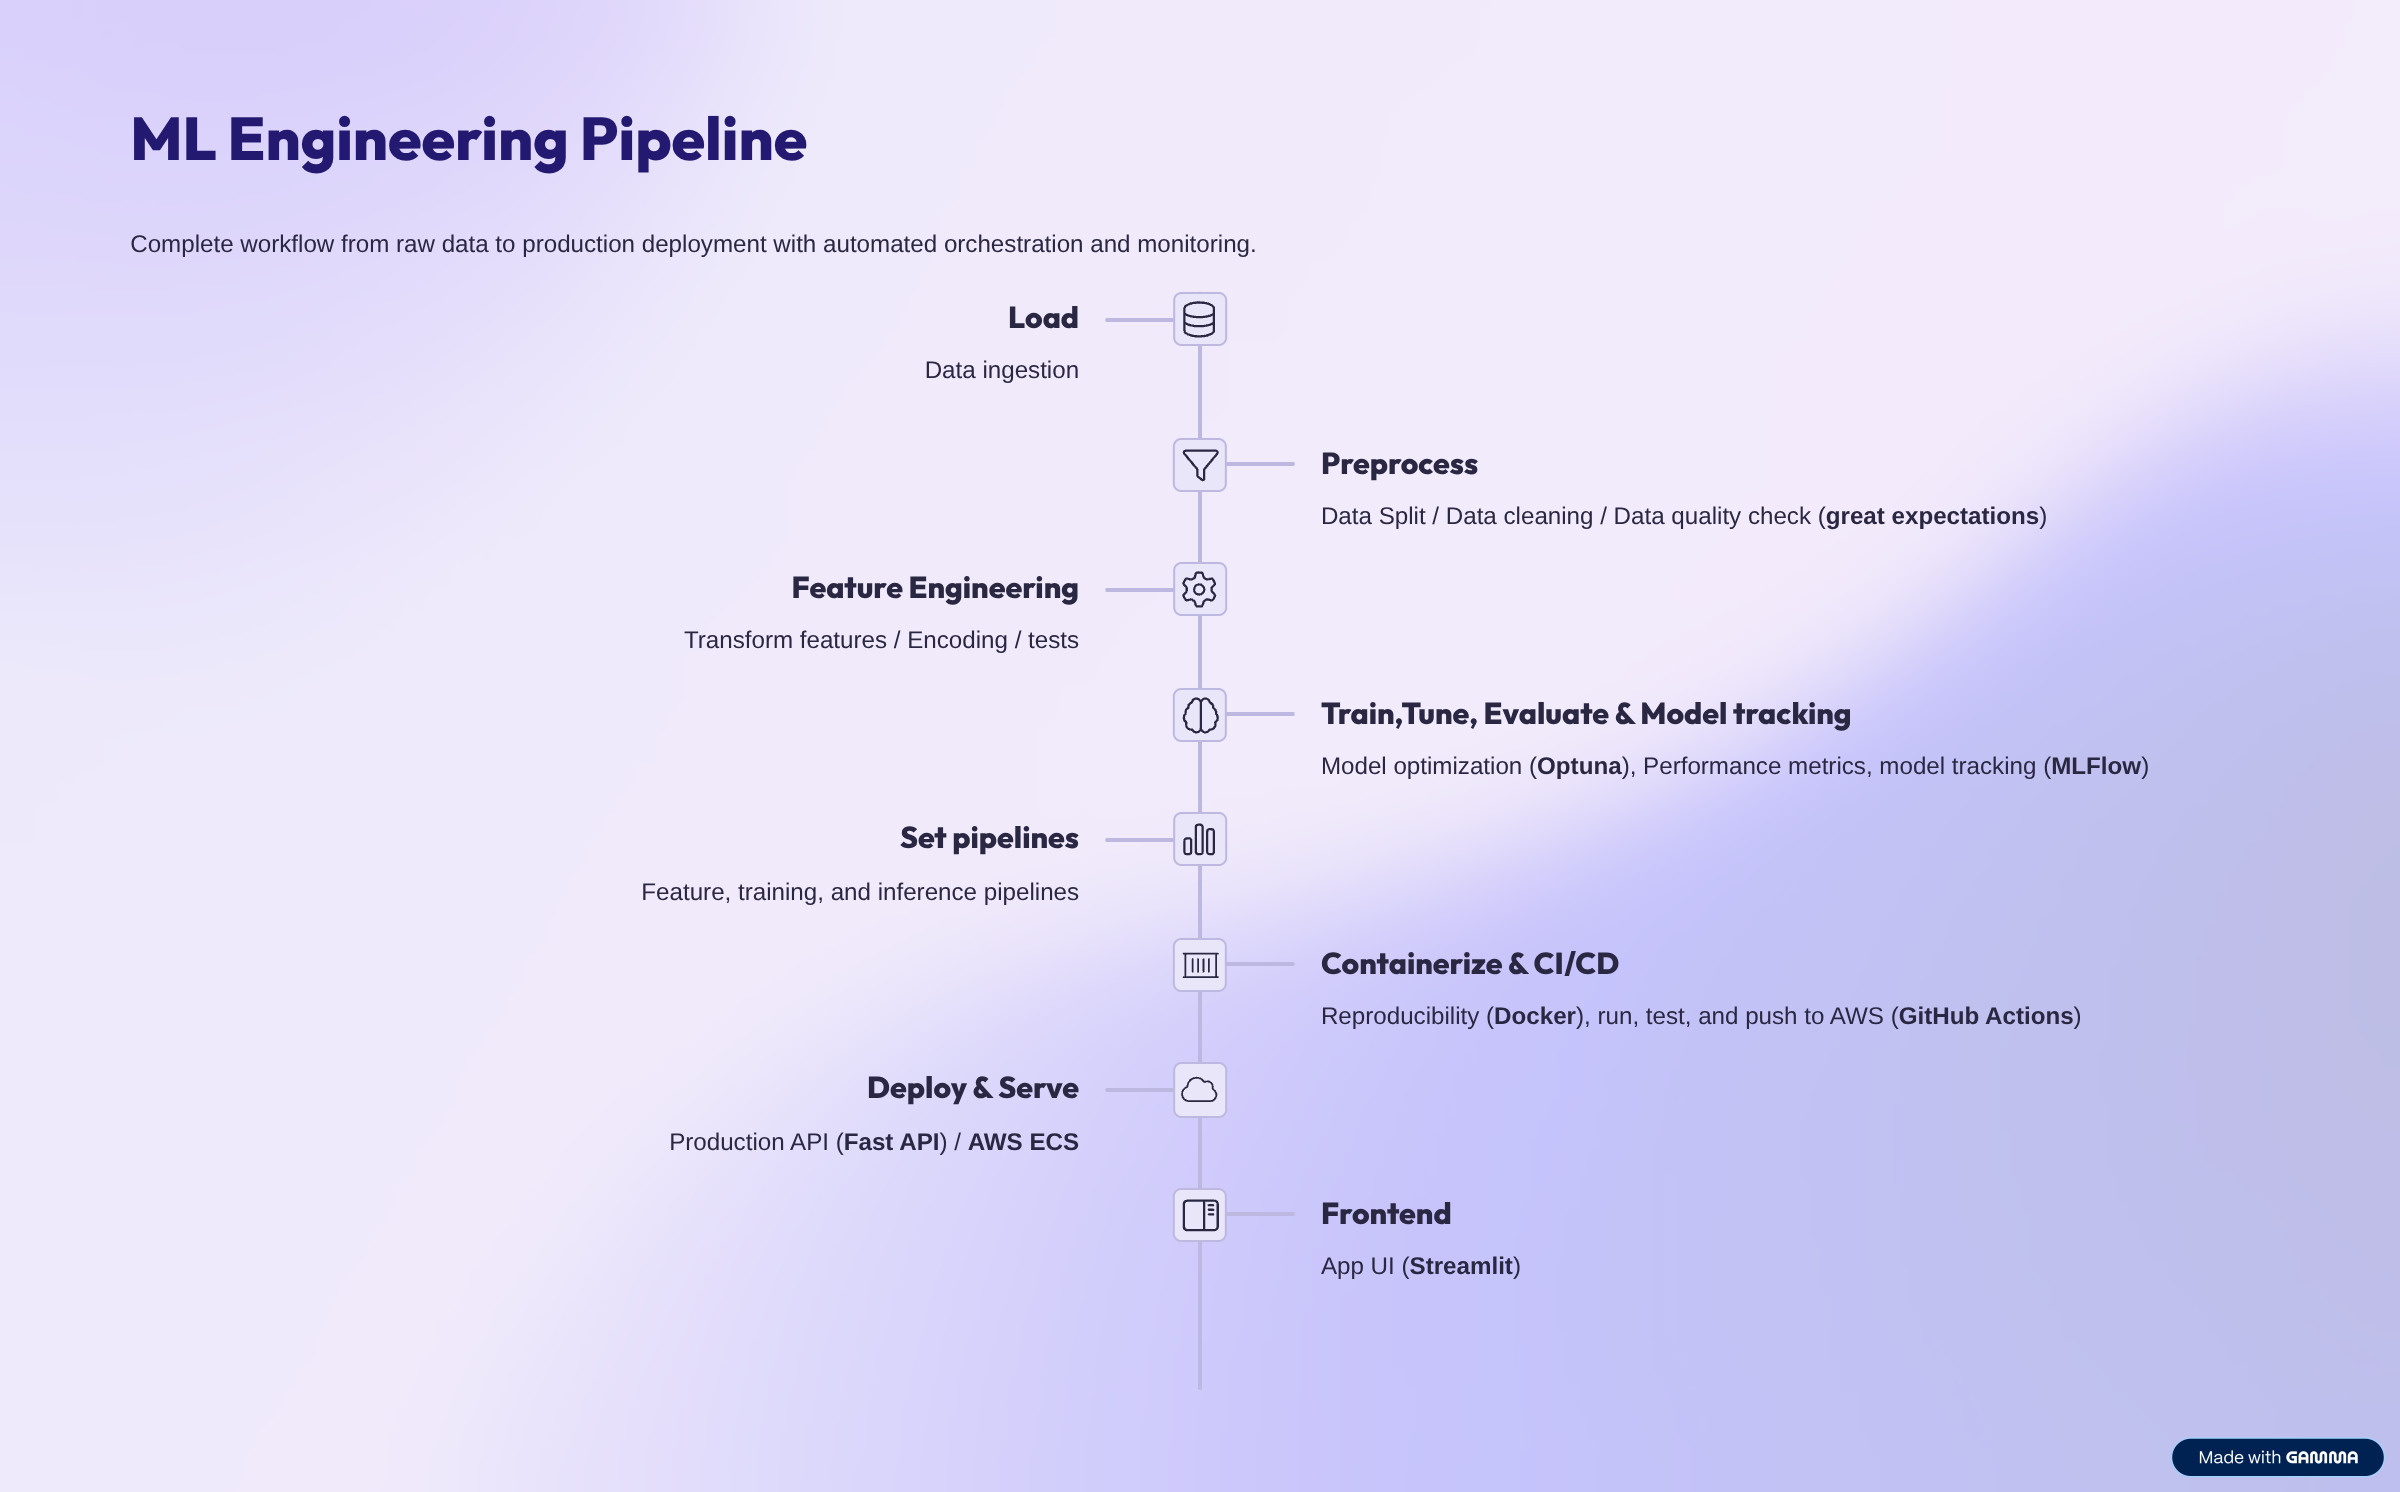
Now that you have set up the environment, cloned the project and installed the libraries with uv, let’s discuss the full pipeline the data is gonna go through.
ML Engineering Pipeline
Phase 1: Load
To load the data, you can follow the link above, download the dataset and put it inside /data/raw and give it a distinct name (i.e HouseTS_original) or use the code in Kaggle to read the dataset directly with a few lines of code.
Phase 2: Preprocess
This step is what makes your data trustworthy. If your data is messy, has lots of outliers, or isn’t split properly, this will cause massive issues along the way, and if you’re lucky enough to push it to production, things will fail in a heartbeat. Let me walk you through the major steps (Again, full code in GitHub Repo here)
2.1 Data Split
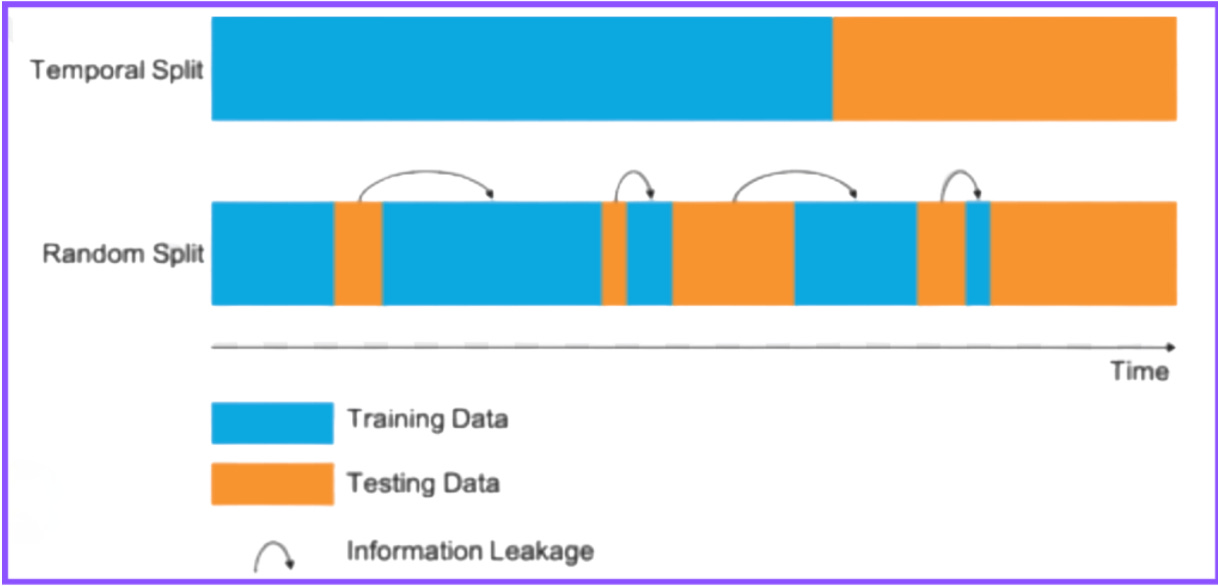
The dataset has temporal data, which means you should be careful about how you split your data. Splitting randomly in this case introduces data leakage. Data leakage happens when your model learns from data it shouldn’t have seen during training. It’s therefore best to split by date, and that’s exactly what I did:
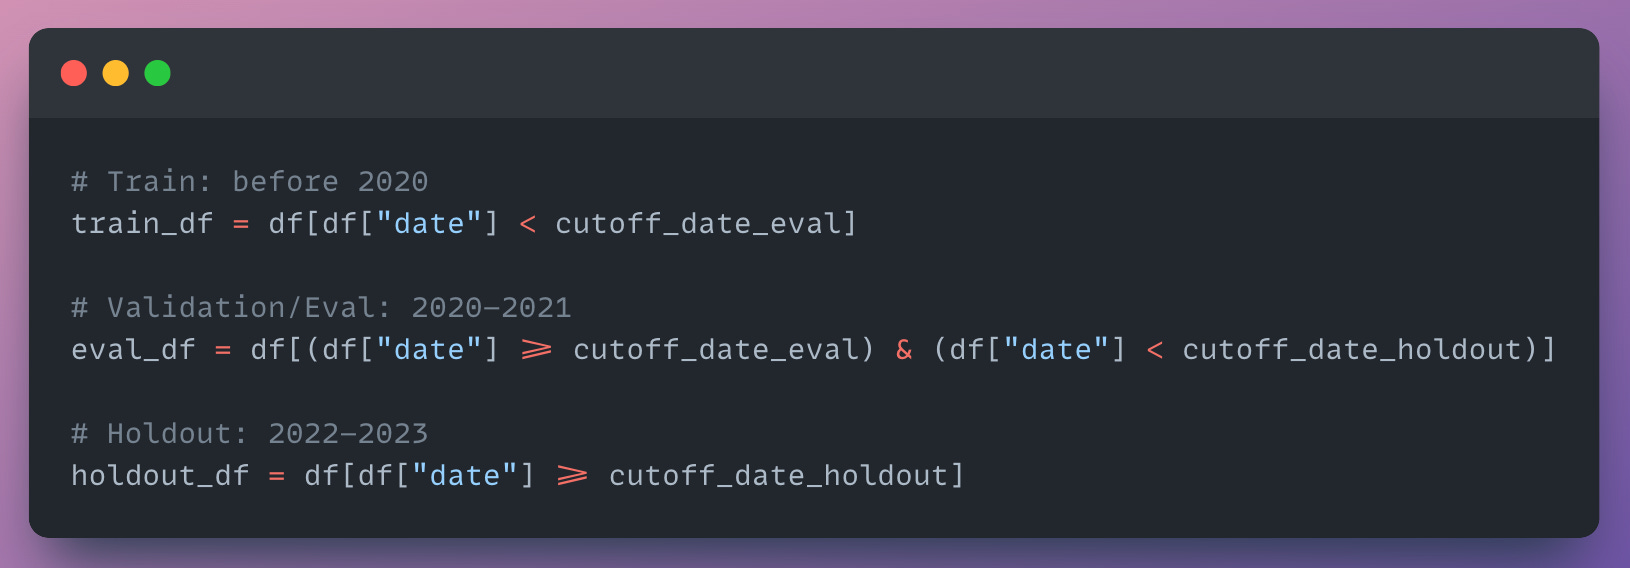
We now have a train dataset (2012-2020), a validation dataset (2020-2021) and a holdout dataset (2022-2023). It’s good practice to leave a holdout dataset completely untouched and use your model on it after training, tuning and testing on validation data.
2.2 Data Cleaning
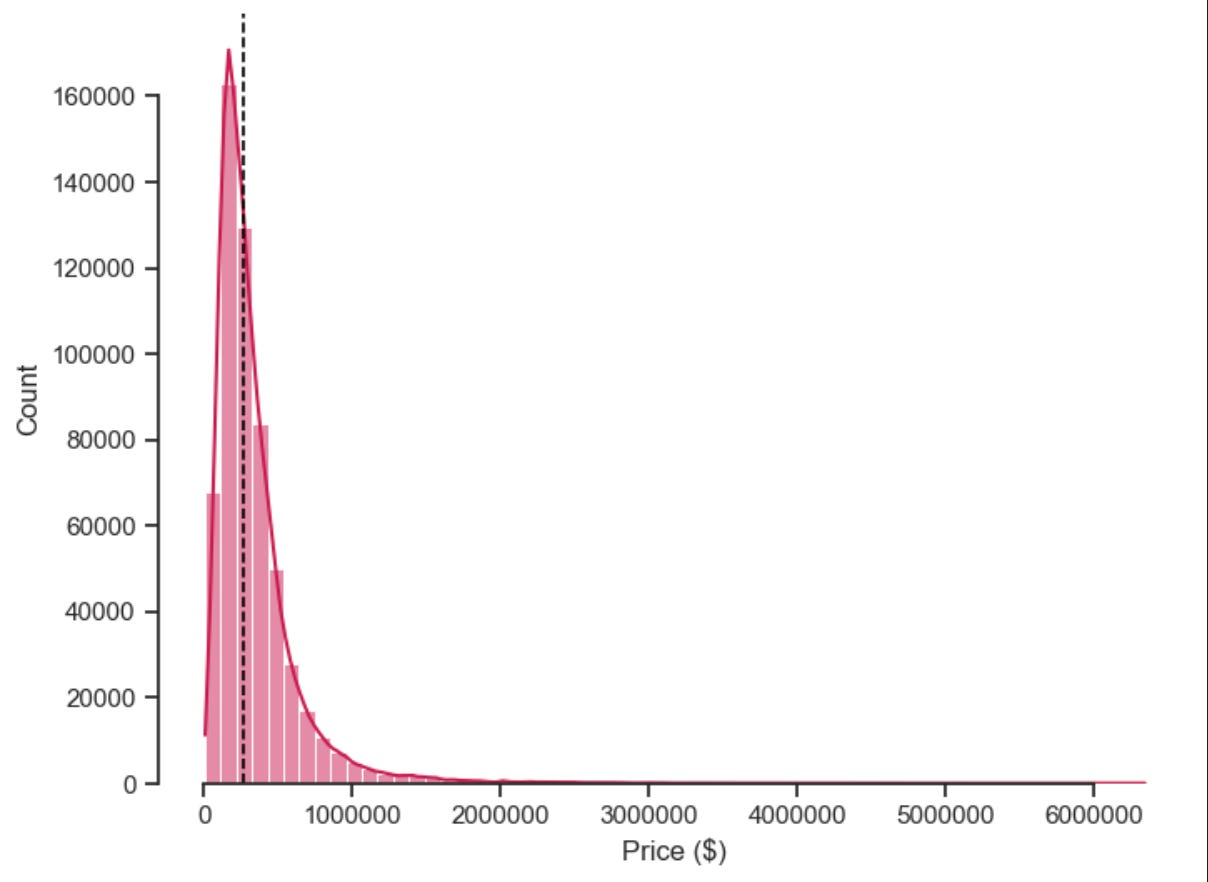
The cleaning step is one of the most tedious and sometimes subjective steps of all. You need to use lots of logic and common sense to know what to keep and what to exclude. In this case, I kept things simple. I removed duplicates and excluded extreme outliers in median_sales_price (some had $1Billion!! haha). Here’s the housing distribution after cleaning:
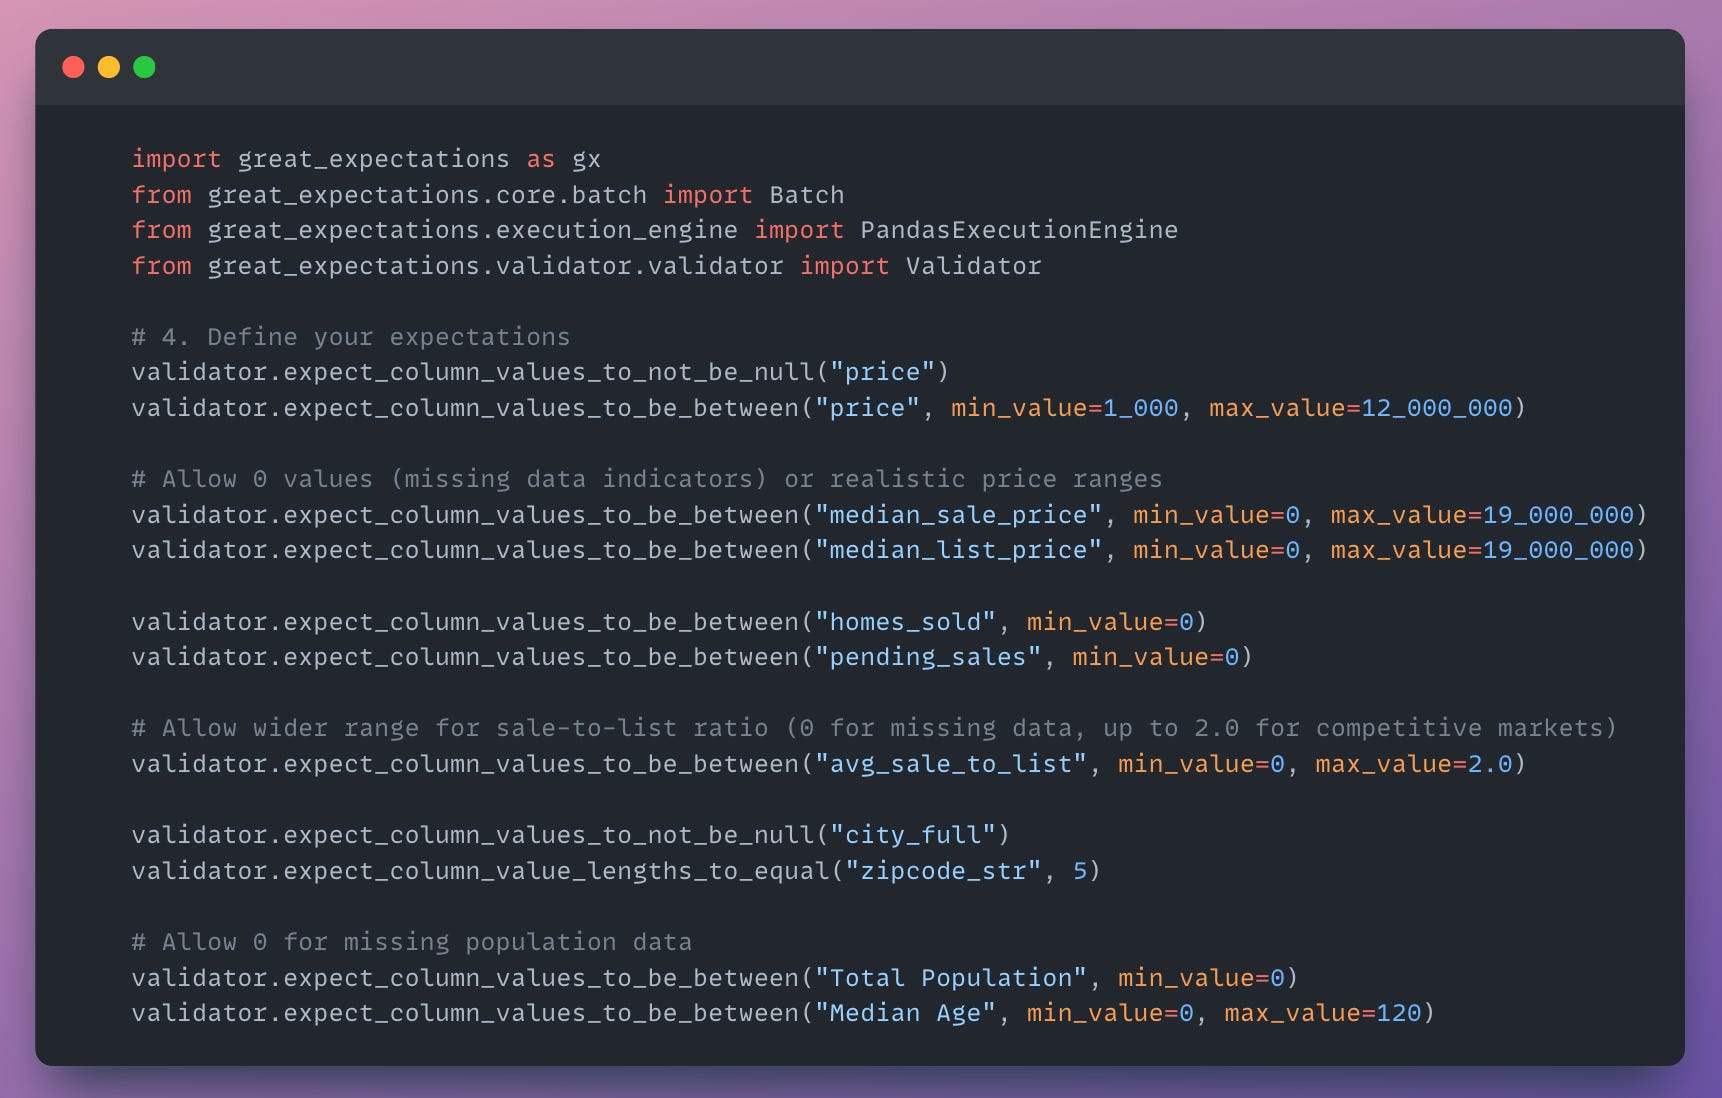
2.3 Data Quality with Great Expectations
Great Expectations is a data quality check library you can use to check if the data is plausible. For example, you don’t want someone to enter age = -3 or housing price = 1 Billion, things like this can be (and should be) spotted early, and great expectations can do it for us. Here’s a snapshot of how it works:
Phase 3: Feature Engineering
The bread and butter of data scientists is making sure the features are ready for machine learning. As you know, ML models thrive on numerical data, so when your features are categorical (textual), you’ll need to find a way to turn them into numbers (encoding).
3 Major Steps:
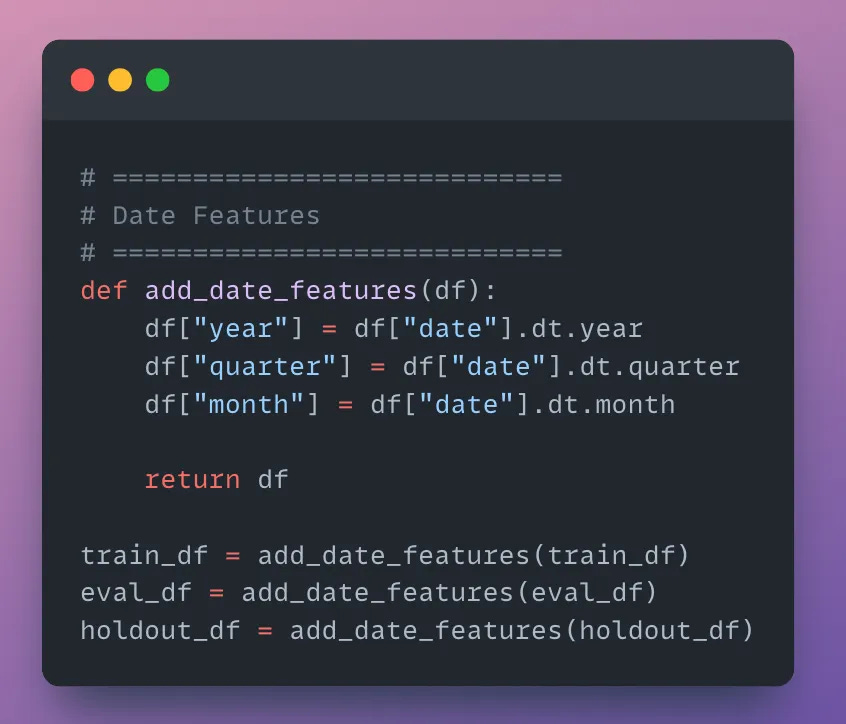
Split the Date column into Years, Quarters, and Months. The reason behind this split is to use it as a filter later in our app
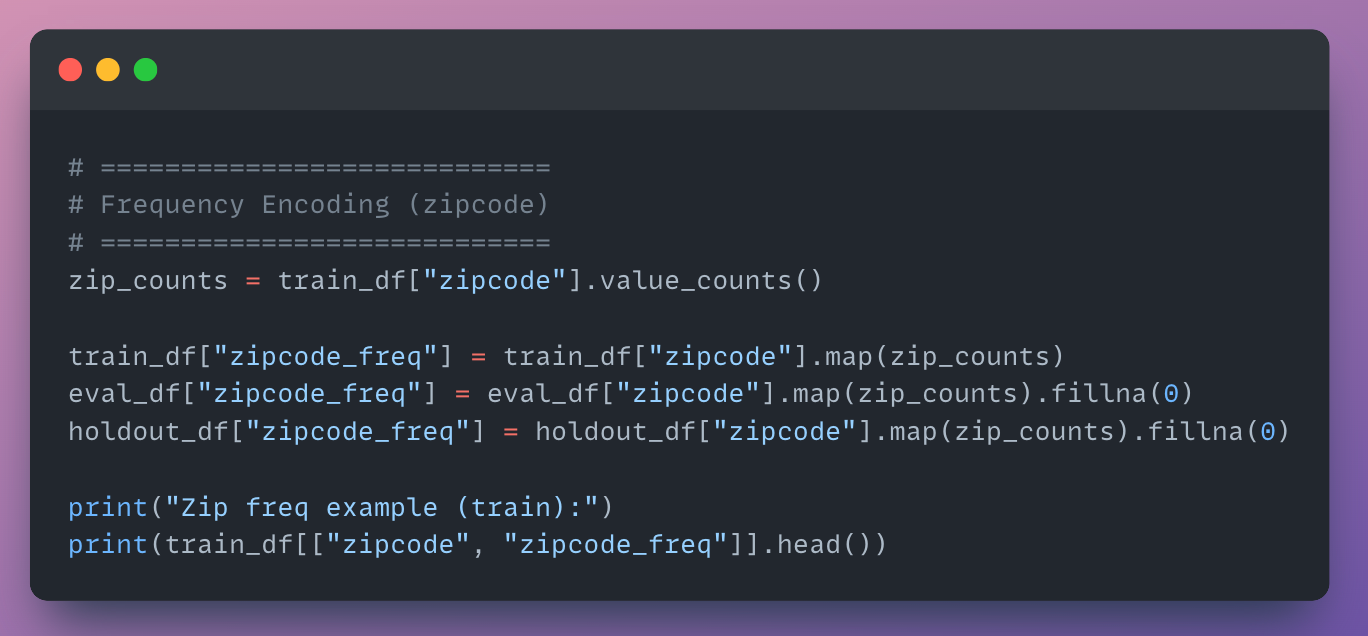
Frequency encoding on ZipCode: Replace each category with how often it appears in the data.
To encode the City_full column, the offered solution is to replace cities with 2 columns, ‘Latitude’ and ‘Longitude’. For that, we need to bring an extra dataset from here, merge it with our dataset and get the lat and long for each city as shown below.
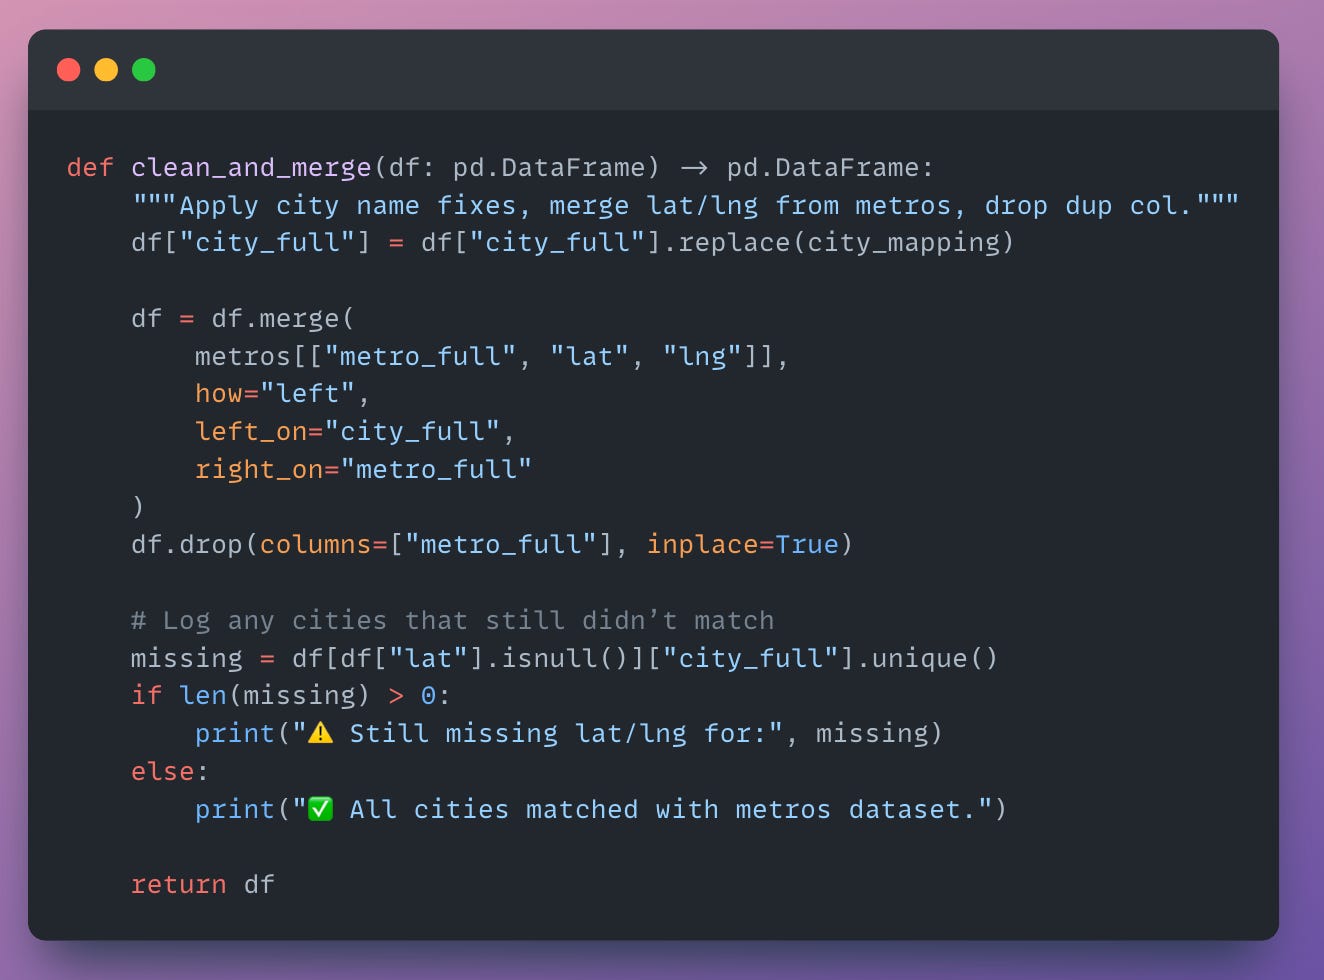
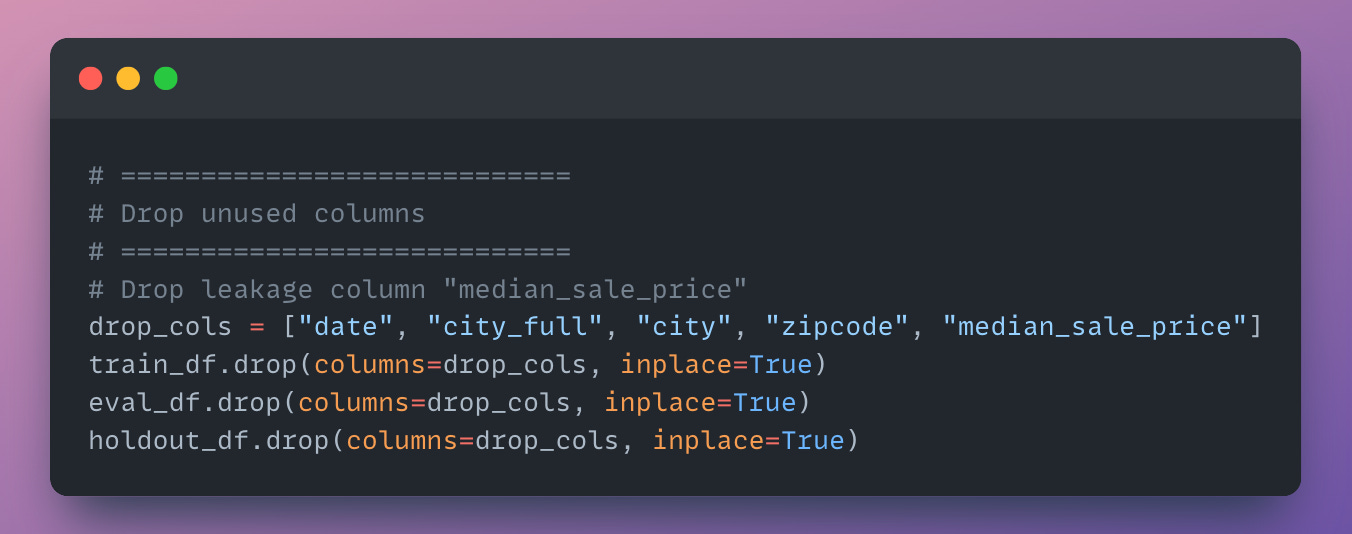
Finally, when doing all the feature engineering, it’s best to drop unnecessary columns (raw unencoded columns) and columns that might introduce data leakage.
Phase 4: Machine learning
After trying a few regression models, I opted for the XGBoost Regressor. It gave the best results and was faster to run. Here it goes in 6 steps:
4.1 Define target & features
The target is the price, the independent features are all the other columns, excluding the ones we mentioned in the Feature Engineering section (Phase 3)
4.2 Training XGBoost
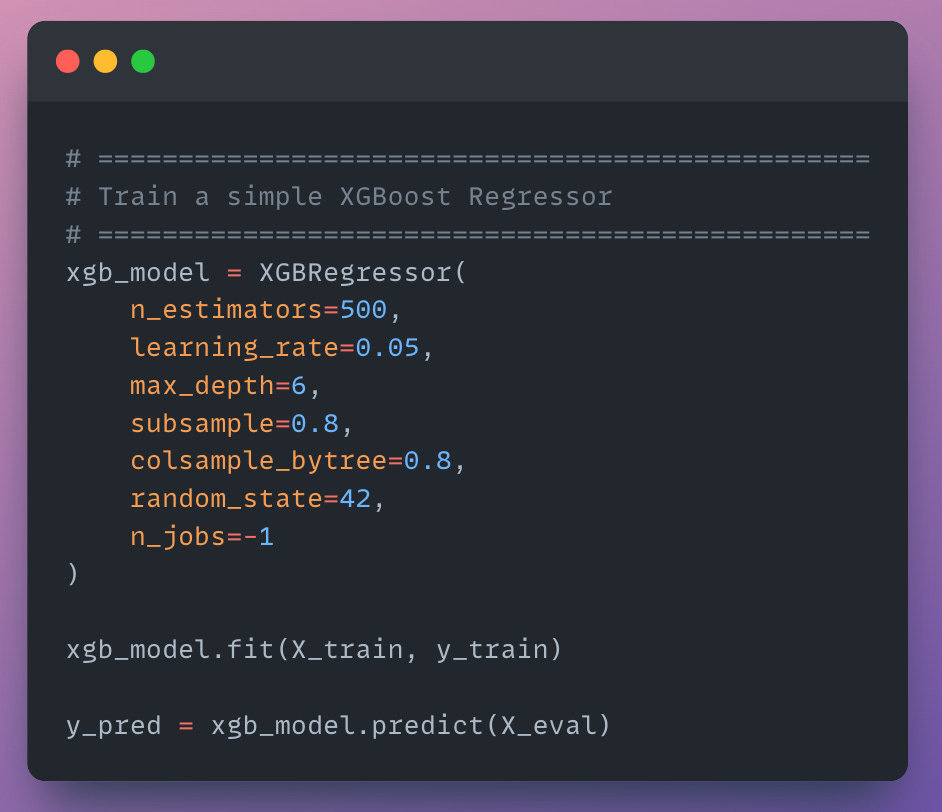
Here we call the model, give it some hyperparameters (will be tuned later), fit on the training sample, then predict on the evaluation sample (basic ML flow).
4.3 ML Metrics (R2, MAE, RMSE)
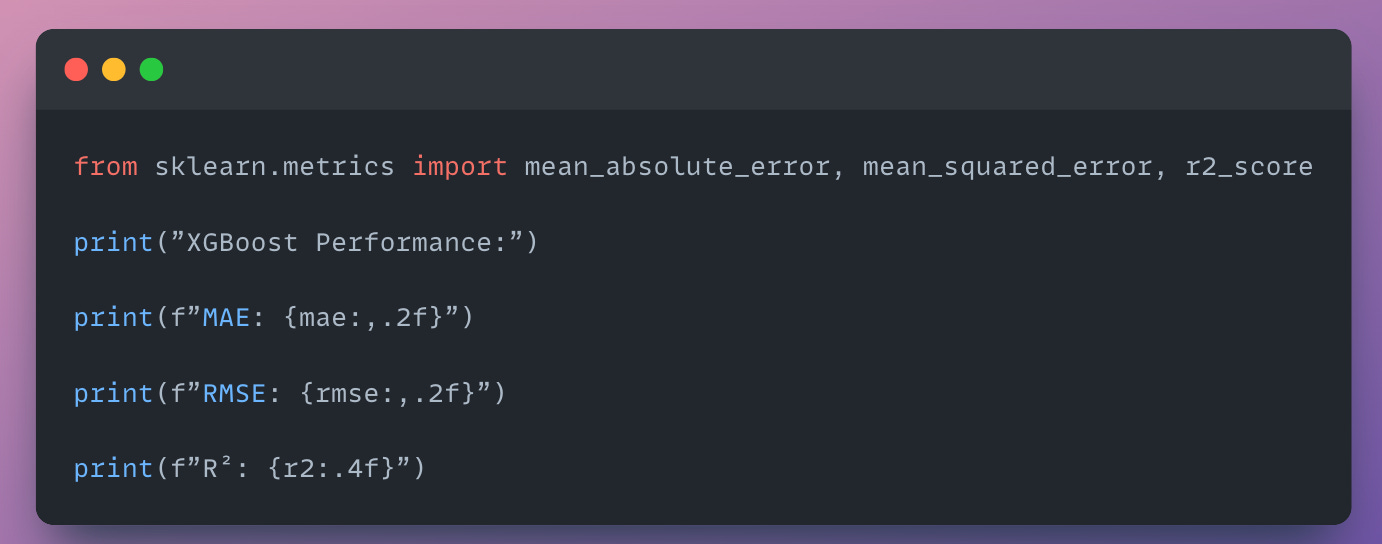
Using scikit-learn, we can easily measure the regression metrics with this:
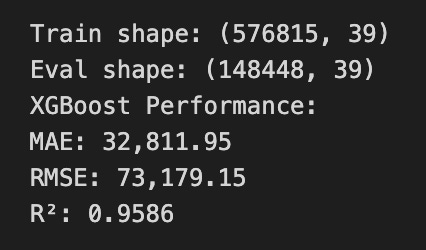
These are the results, pretty solid, hein?
4.4 Interpret results
The model predicts house prices quite accurately; it explains about 96% of the variation in prices (R² = 0.9586). On average, predictions are off by about £33K, with larger errors (RMSE ≈ £73K) happening on more expensive or unusual houses.
4.5 Hyperparameter Tuning (Optuna)
Earlier, we set random hyperparameters just to get started. Now we are going to fine-tune those hyperparameters, which basically means finding the best possible combination to improve the previous metrics. For that, we’re going to use Optuna.
Optuna is a tool that automatically finds the best hyperparameters for your machine learning model to improve its performance.
For each parameter, we set a range then we set a number of trials. More trials mean more computing and time consumed, but also mean higher chances of getting a better hyperparameter combination.
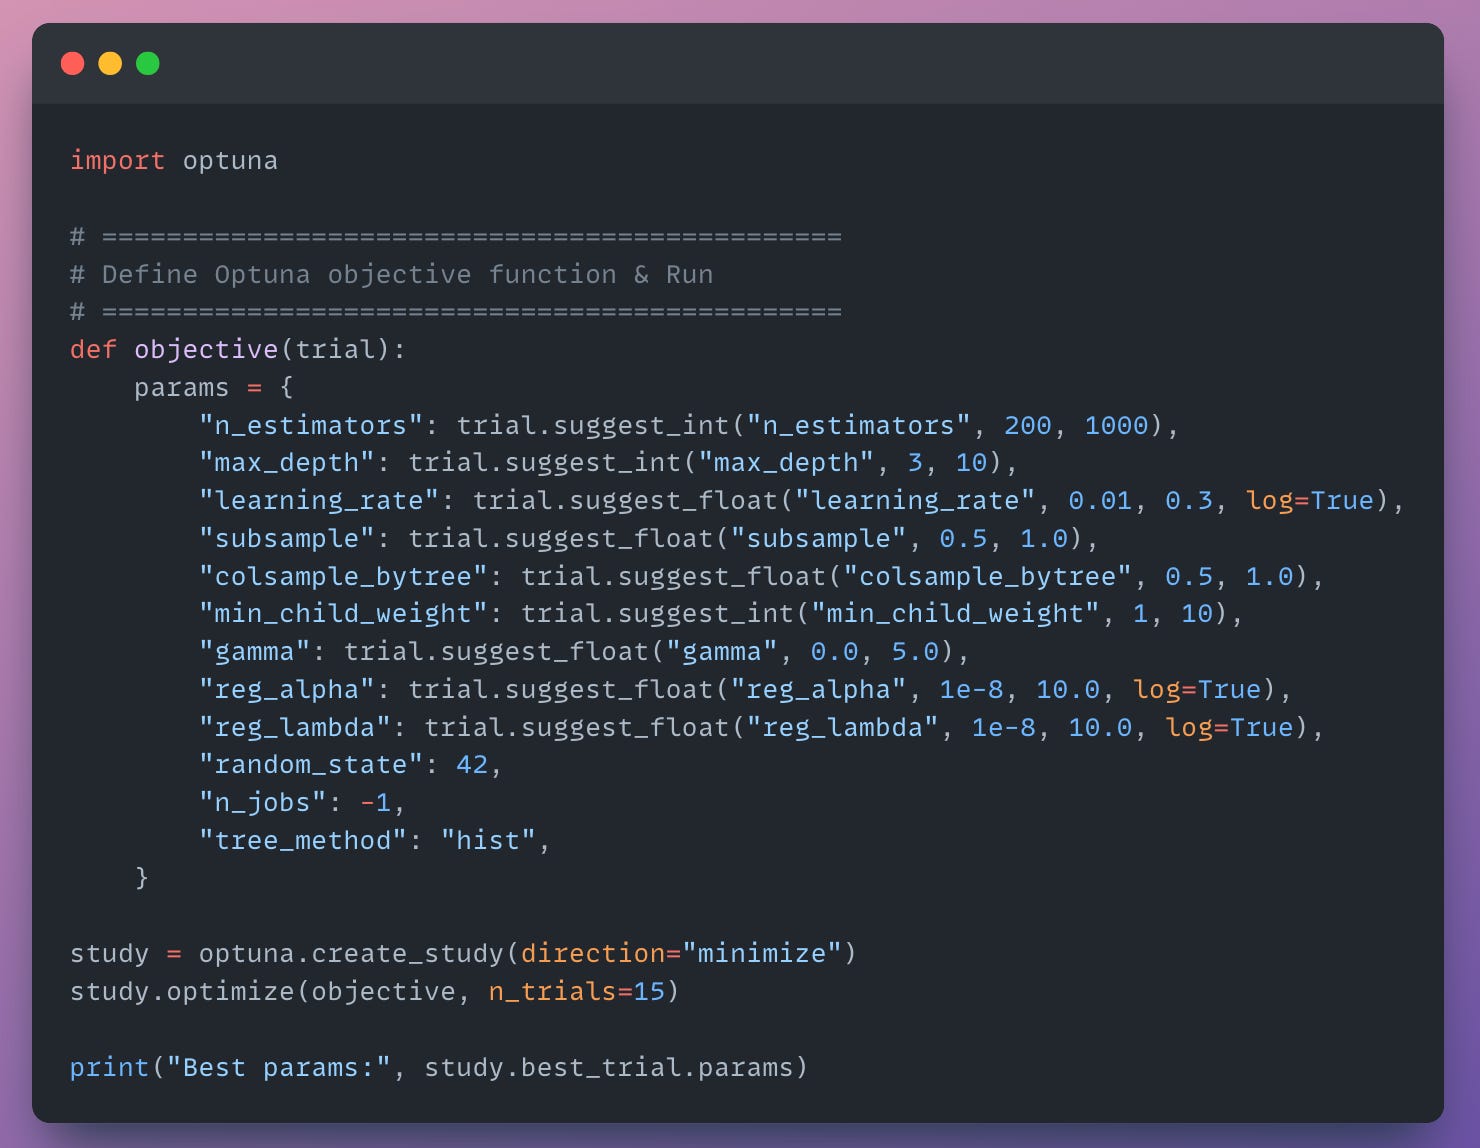
After running Optuna, we should see something like:
Best params: {’n_estimators’: 446, ‘max_depth’: 9, ‘learning_rate’: 0.028458141898131586, ‘subsample’: 0.8970372115260677, ‘colsample_bytree’: 0.6867337932853605, ‘min_child_weight’: 9, ‘gamma’: 2.804950513221669, ‘reg_alpha’: 1.1884539469908749e-07, ‘reg_lambda’: 1.7062403052654664}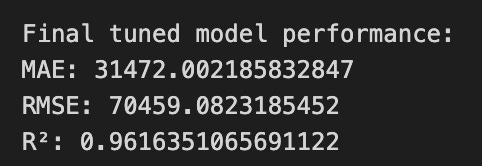
By finetuning the model’s hyperparameters, we got an improvement in the model.
4.6 ML Experiment tracking (MLFlow)
MLflow is a tool that helps you track, manage, and reproduce your machine learning experiments and models. Think of it as Git/GitHub for your ML experiments. Let’s say we used Optuna to fine-tune the hyperparameters and got good results today, then we keep iterating over the weeks, but somehow we want to revert back to an old model that performed well. Without MLFlow, you wouldn’t remember hyperparameters from weeks ago, or you would have to manually enter the values in Excel, which is not effective and prone to human errors.
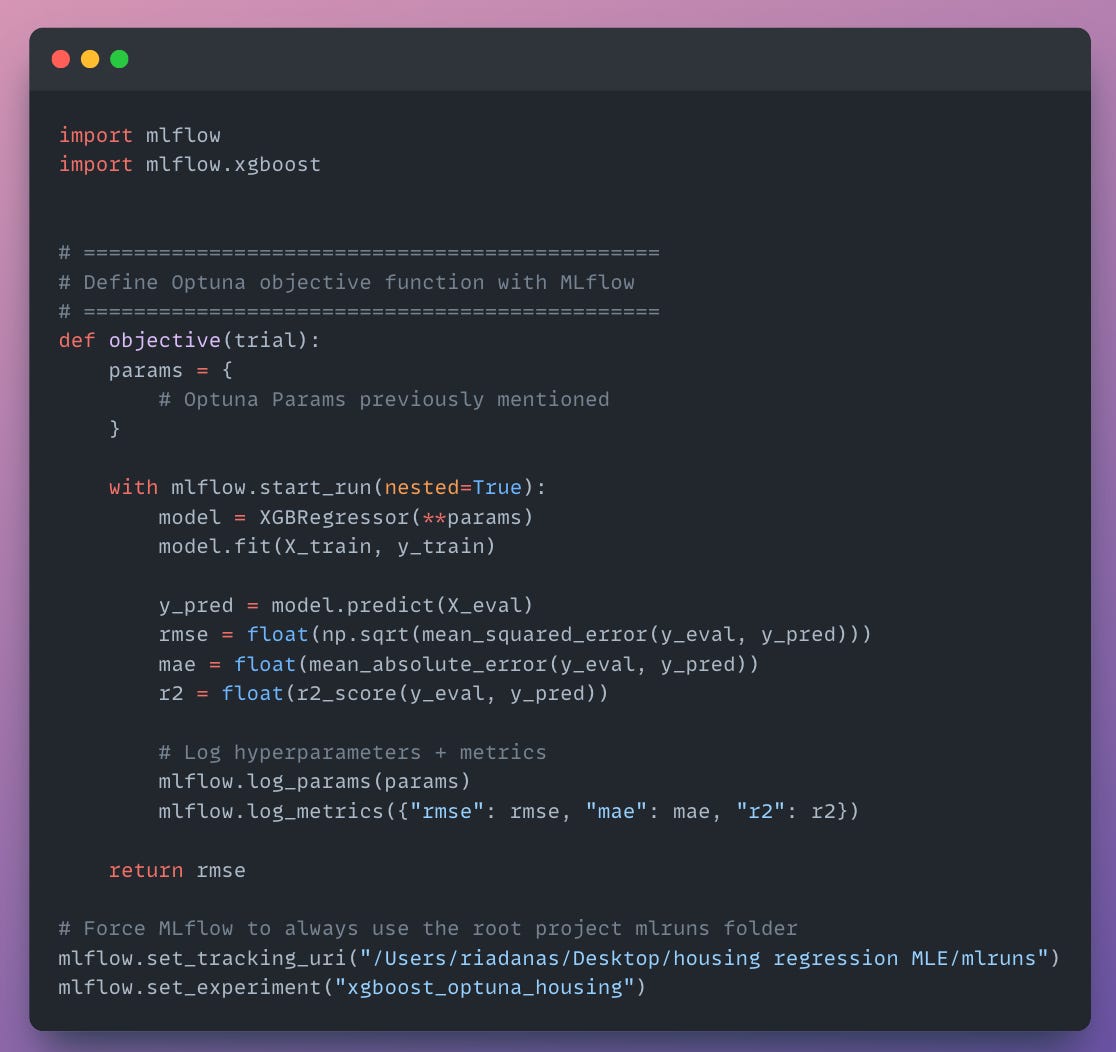
MLFlow will help us save the hyperparameters and metrics as experiments that we can compare with other experiments. If you want to see this visually, just run mlflow ui in your project’s terminal.
Alright! We have basically completed the project here. We went from raw data, into feature engineering, into ML modelling and fine-tuning, so nothing is stopping us from calling it a day and going to sip some mojitos, right? Not quite! Your model only works on your computer and can’t be used by anyone else, and that’s where we need to add the engineering components to make this work and usable from anywhere.
Phase 5: Modularise pipelines
Working with notebooks is nice and pleasant because it’s interactive and you can run and debug cells straight away. So lots of data scientists default to notebooks when they start their careers (I did too). The issue with notebooks is that they are difficult to automate and run within a pipeline. It’s possible but clunky. Therefore, it’s best to turn the notebooks into Python scripts that are split into:
Feature Pipeline: responsible for loading, cleaning and feature engineering
Training Pipeline: responsible for training, tuning, and evaluating the ML model.
Inference Pipeline: responsible for running the whole pipeline and making predictions.
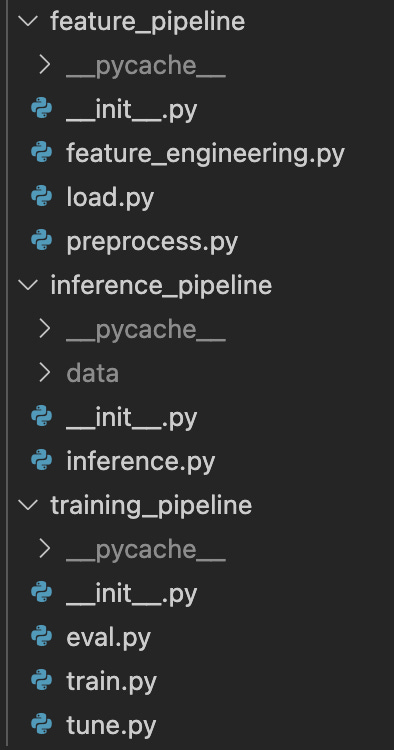
Think of it as splitting each part of the logic into a function. This way, it’s easier to update if needed without rewriting all the logic.
Phase 6: Containerise & CI/CD
Containers and CI/CD are 2 major topics in MLOps which derive from DevOps. Let’s dive into them!
6.1 Containers (Docker)
Docker is a tool that packages your code, libraries, and environment into a single container so it runs the same everywhere. In ML projects, it helps avoid setup issues and ensures your model works identically across different machines or cloud servers.
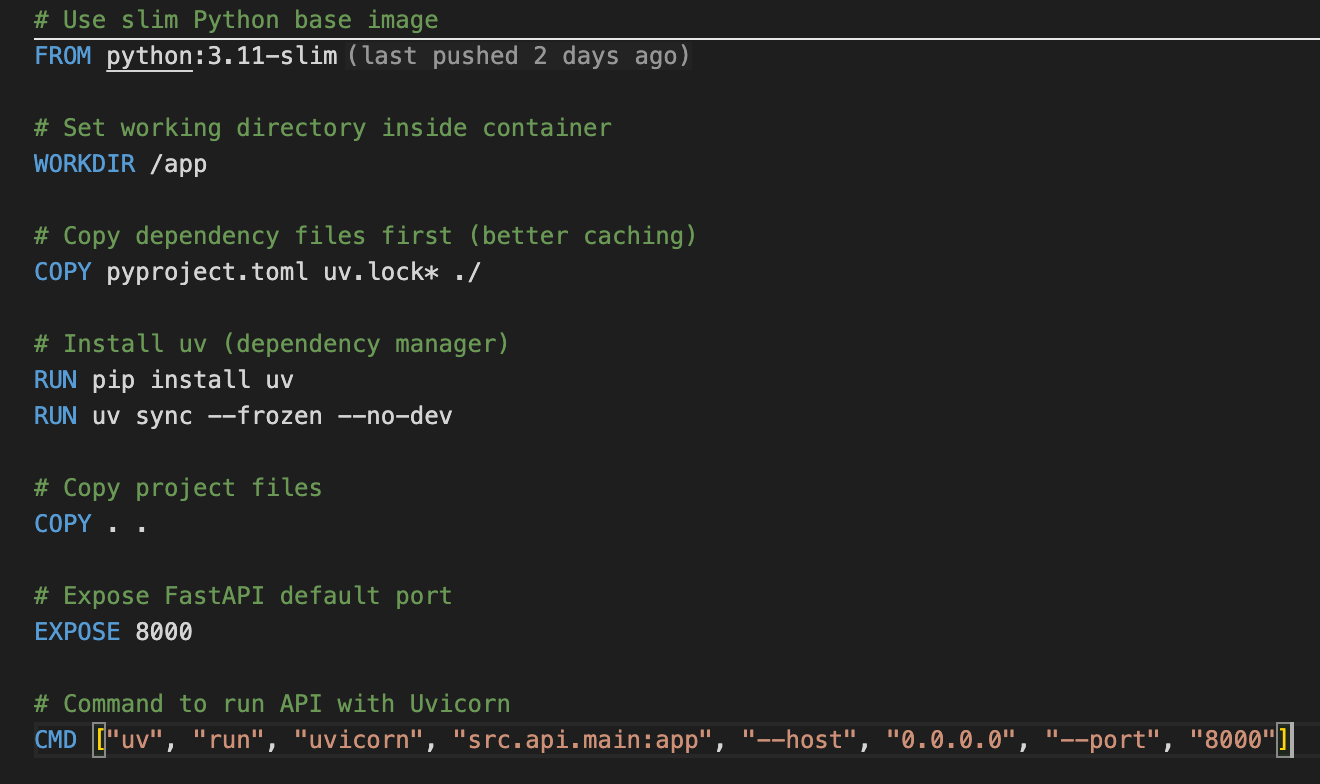
This Dockerfile creates a lightweight Python container, installs dependencies using uv, copies the project files, exposes port 8000, and runs the FastAPI app with Uvicorn.
PS: FastAPI app is detailed in Phase 7
In this project, I have created 2 distinct Dockerfiles: the one above for the main project structure and dependencies, and one mainly focused on the UI (Streamlit). Having Separate Dockerfiles for UI and FastAPI avoids mixing UI logic with backend logic.
6.2 CI/CD (GitHub Actions)
A CI/CD pipeline automatically tests, builds, and deploys your code whenever you make changes. GitHub Actions helps by running these steps for you each time you push to GitHub, so everything stays consistent and error-free.
The CI/CD code lives inside /github/workflow/ci.yml
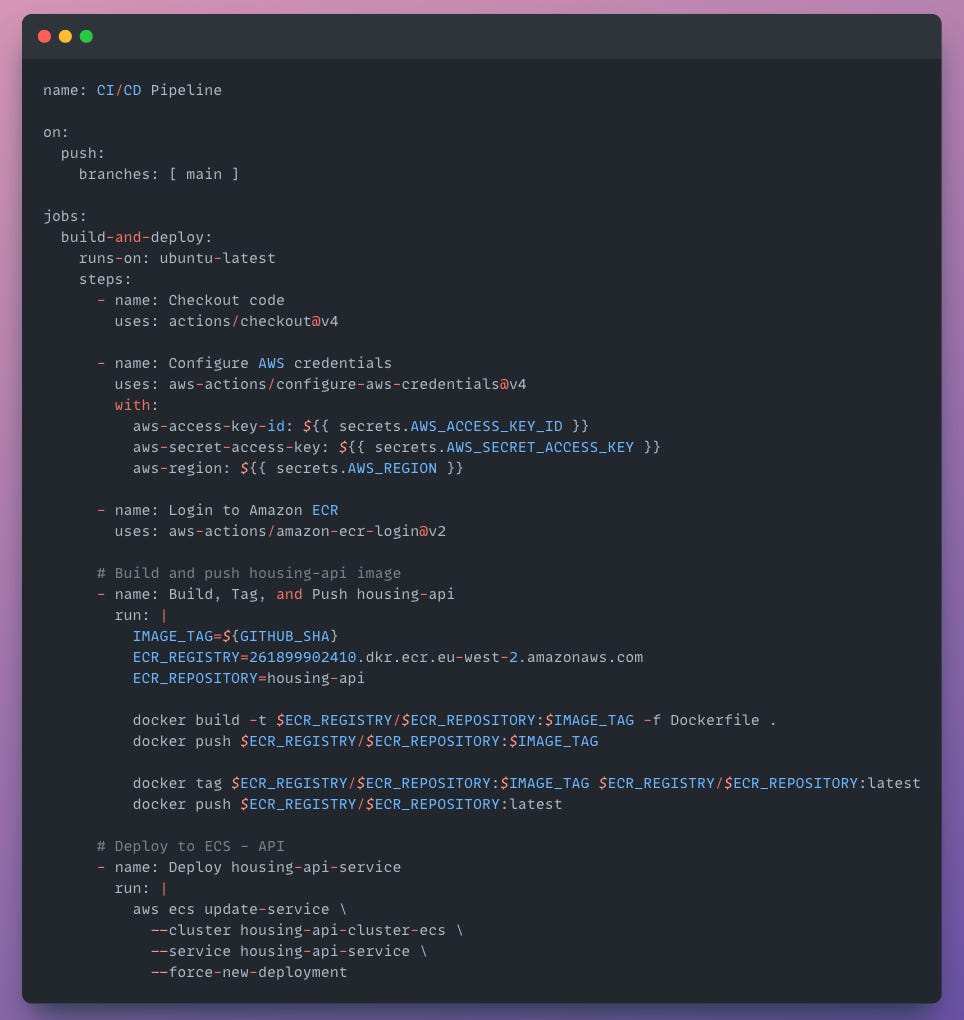
Here’s a short breakdown of the CI/CD phases in our pipeline:
Trigger - Push to GitHub
Checkout phase – Pulls the latest project code from GitHub.
Setup phase – Configures AWS credentials and logs into Amazon ECR.
Build phase – Builds Docker images for both the API and Streamlit app.
Push phase – Pushes those images to AWS ECR (container registry).
Deploy phase – Updates ECS services so the new versions go live automatically.
Tip: Store your secrets in GitHub Secrets. Credentials for AWS (access keys or ECR Registry)
Phase 7: Deploy (AWS) & Serve (FastAPI)
7.1 FastAPI Endpoint
FastAPI is a Python framework for building APIs quickly and efficiently. In ML projects, it’s used to serve your trained model so others can send data and get predictions through an API, and when deployed on AWS (like ECS or Lambda), it makes your model accessible online for real use.
In your FastAPI script, you need to include these endpoints:
@app.get(”/”) - simple landing endpoint to confirm API is alive.
@app.get(”/health”) - checks if model exists, returns status info
@app.get(”/predict”) - Prediction Endpoint: This is the core ML serving endpoint
Test in terminal with: uvicorn src.api.main:app --reload
7.2 AWS Deployment
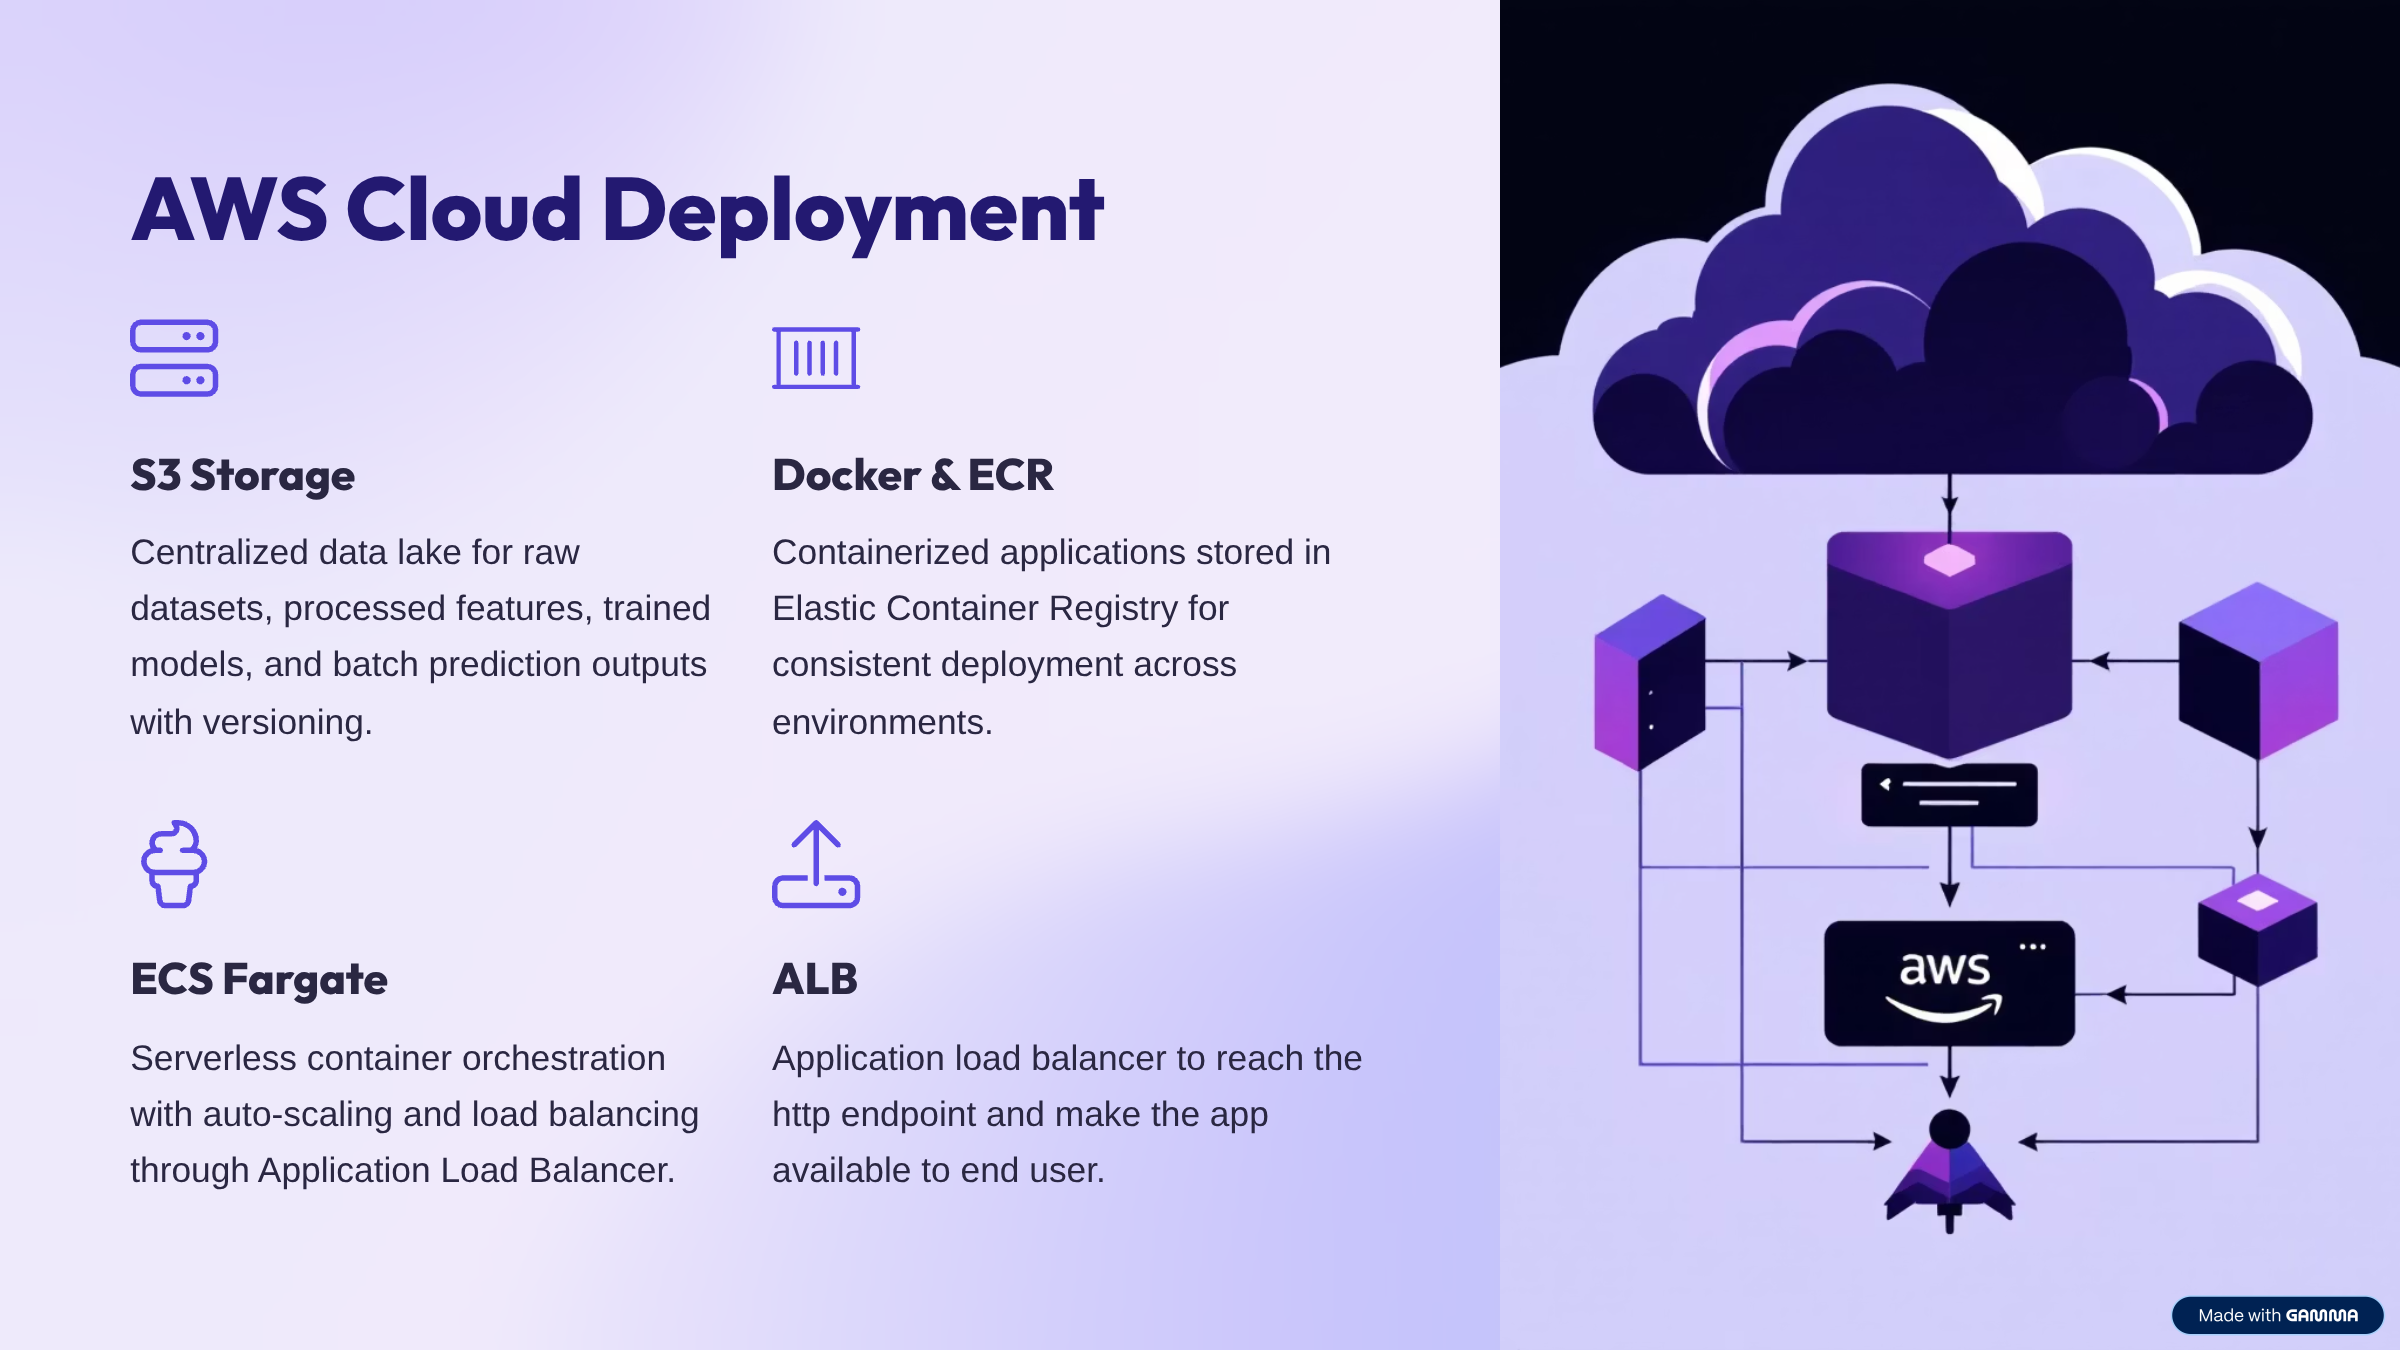
We deployed a machine learning model on AWS using Docker, FastAPI, Streamlit, and GitHub Actions for automation. You can do this with a free AWS account (or spend a few dollars if needed). If you can’t, just follow along to learn.
⚙️ Setup Steps
Create an AWS Account
Use the Free Tier if possible.
Create an IAM user, give it ECR, ECS, and S3 permissions, and generate access keys.
Save these keys as GitHub Secrets (
AWS_ACCESS_KEY_ID,AWS_SECRET_ACCESS_KEY,AWS_REGION).
S3 Bucket
We created it programmatically in VSCode from the project code to store data and model files.
ECR (Elastic Container Registry)
Stores your Docker images built from the CI/CD pipeline in GitHub Actions.
GitHub Actions builds, tags, and pushes your container images to ECR using the access keys stored as secrets.
Networking (VPC + Subnets)
Create a VPC with public subnets to let ECS services run securely inside your own network.
ECS Fargate (Container as a Service)
Runs your Docker containers directly without managing servers.
You create task definitions to describe how each container runs (CPU, memory, ports, image, etc.).
ALB (Application Load Balancer)
Routes traffic to your ECS containers and gives you a public URL to access your app.
It’s useful for scaling and handling multiple containers smoothly.
Containers and Services
We deployed two services:
housing-api-service(FastAPI backend)housing-streamlit-service(Streamlit frontend)
Each has its own ECR repo and ECS task definition.
Monitoring
Use CloudWatch to monitor logs, container health, and performance metrics.
💰 Cost Notes
ECR and S3 are cheap (storage-based).
ECS (Fargate) and ALB are the main cost drivers.
Stop ECS services and ALB when not in use to avoid paying for idle resources.
It cost me 25$ to run this project in 3 weeks of work, which can easily be cut to 10$ if careful (or use free tier)
Phase 8: Frontend (Streamlit)
Streamlit is a Python tool that lets you turn your data or ML scripts into interactive web apps with very little code. It’s great for quickly building dashboards or model interfaces without needing front-end skills. The result will look similar to what’s below.
Conclusion: What have we built?
We built an end-to-end machine learning regression pipeline covering every stage, from data loading, time-based splitting (train, eval, holdout), cleaning, and feature engineering to modelling with XGBoost and hyperparameter tuning using Optuna. We tracked experiments with MLflow, modularised the workflow into Python scripts (feature, training, and inference pipelines), containerised the project into two Docker images (main app and Streamlit UI), and set up a CI/CD pipeline with GitHub Actions to deploy everything on AWS. Finally, we built a simple Streamlit interface for users to interact with the model.
I felt breathless just typing the previous paragraph, haha, if you felt the same, remember the video tutorial can show you this in detail :)
And that’s everything for today!
Let’s keep building!
I enjoyed writing this article. Thanks for the invitation Miguel!
Thanks for the good 😊